
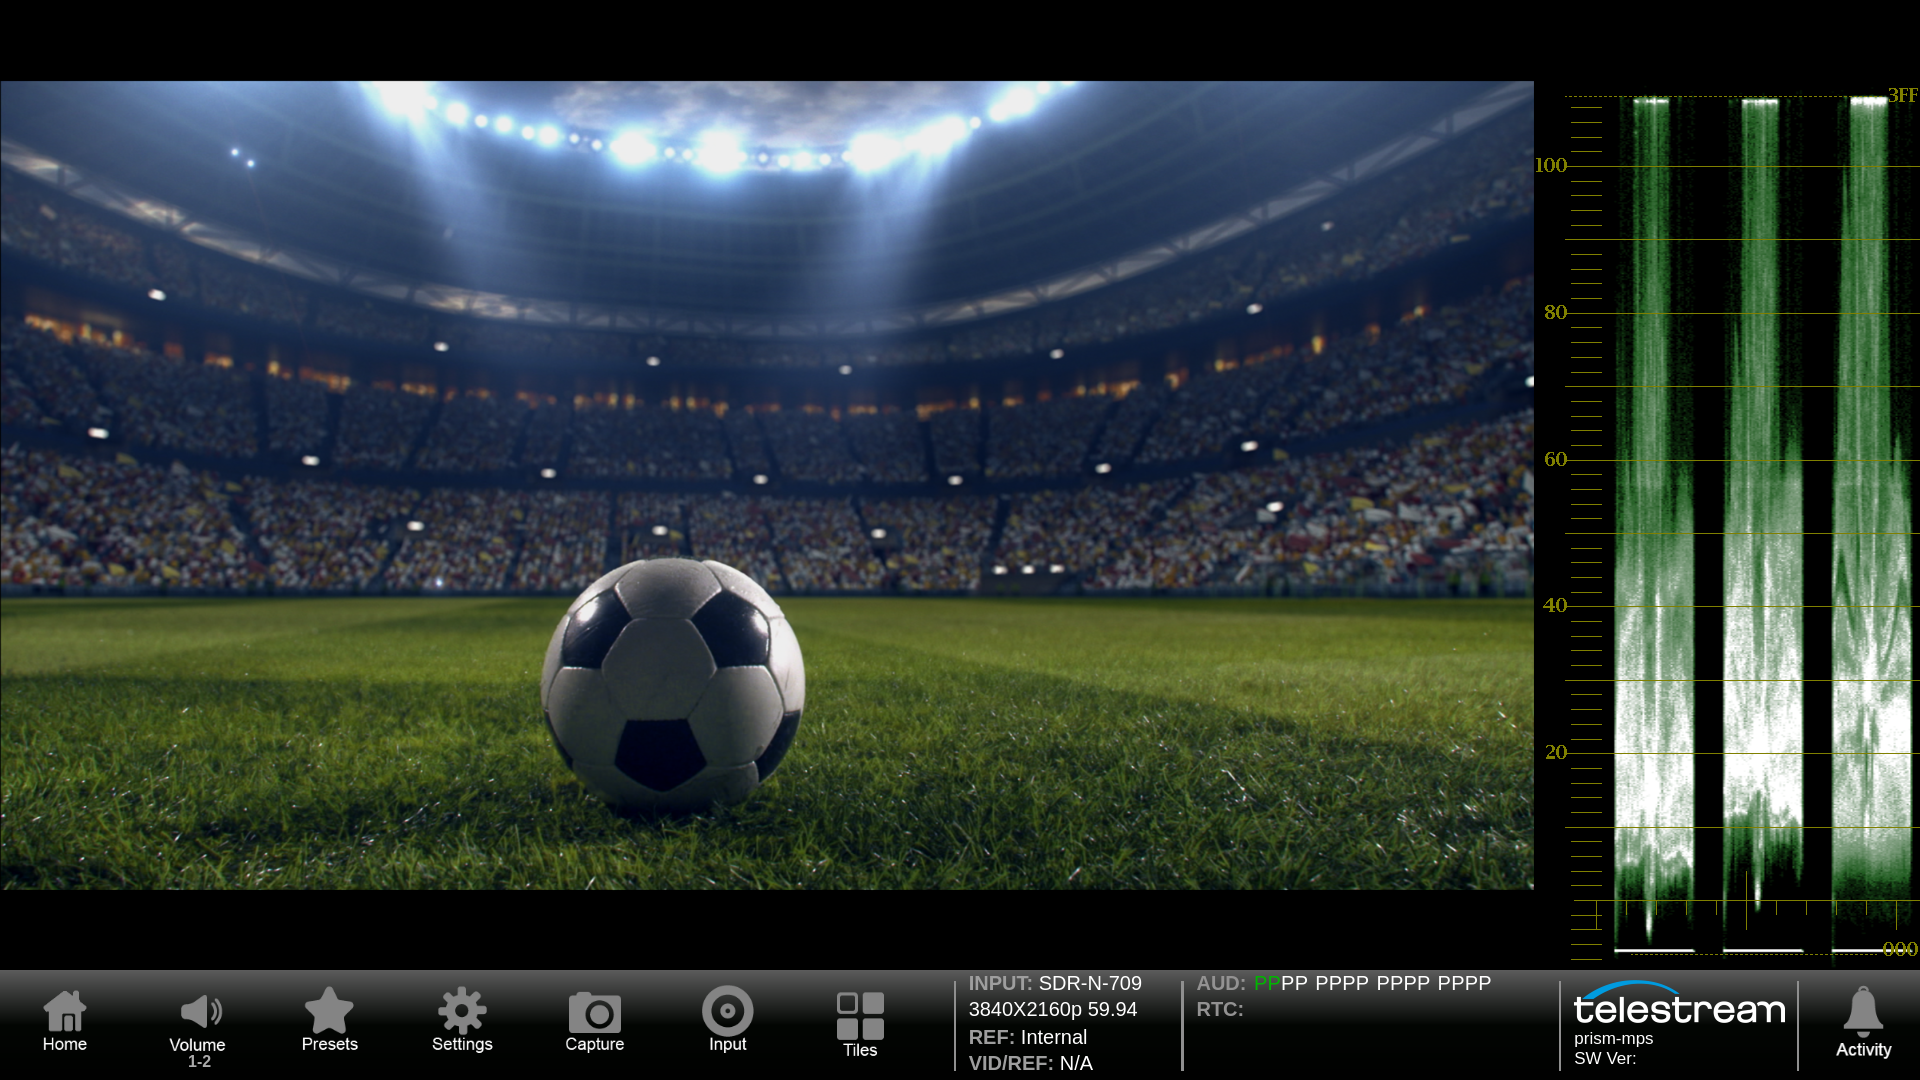
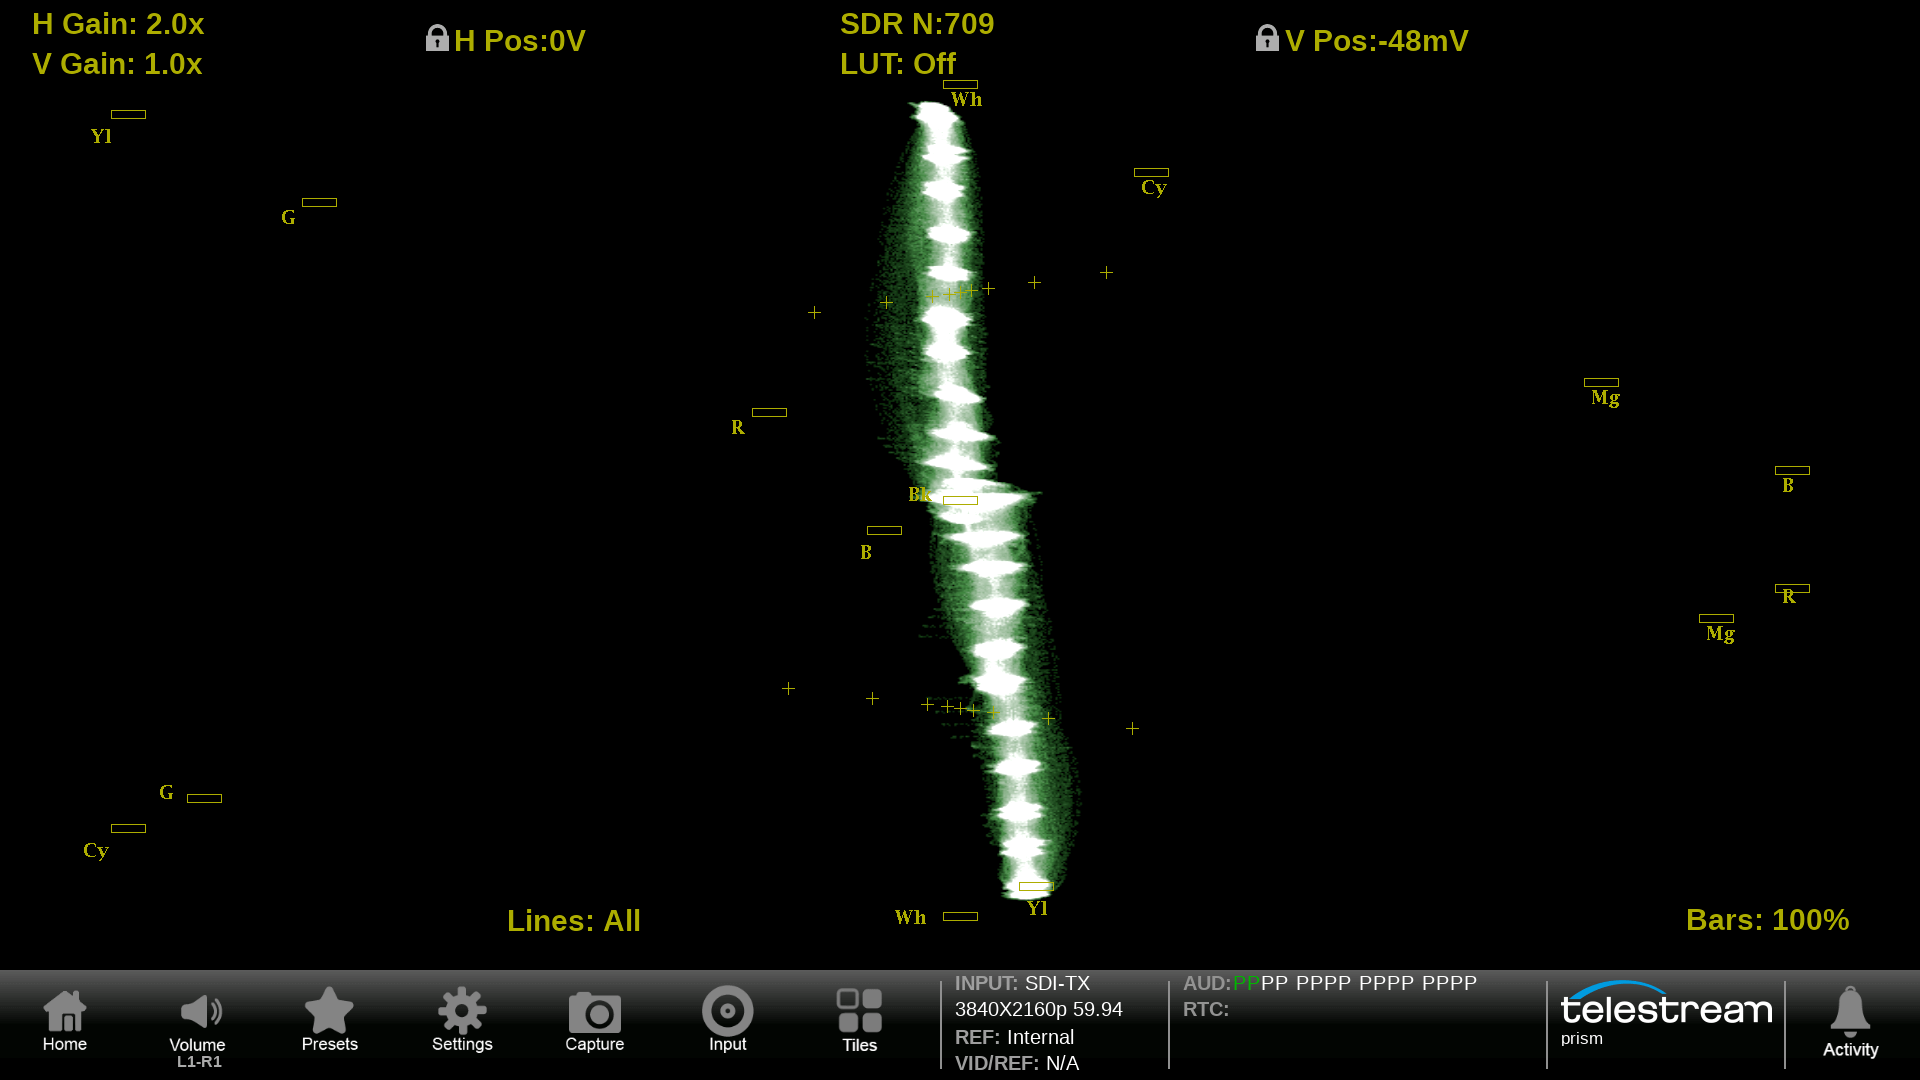
Waveform Monitor
A full-featured waveform display with impeccable trace quality and dimension that allows users to pick out detail important to the job. Customize the measurements quickly and easily for NITs, 5X magnification, or line select.
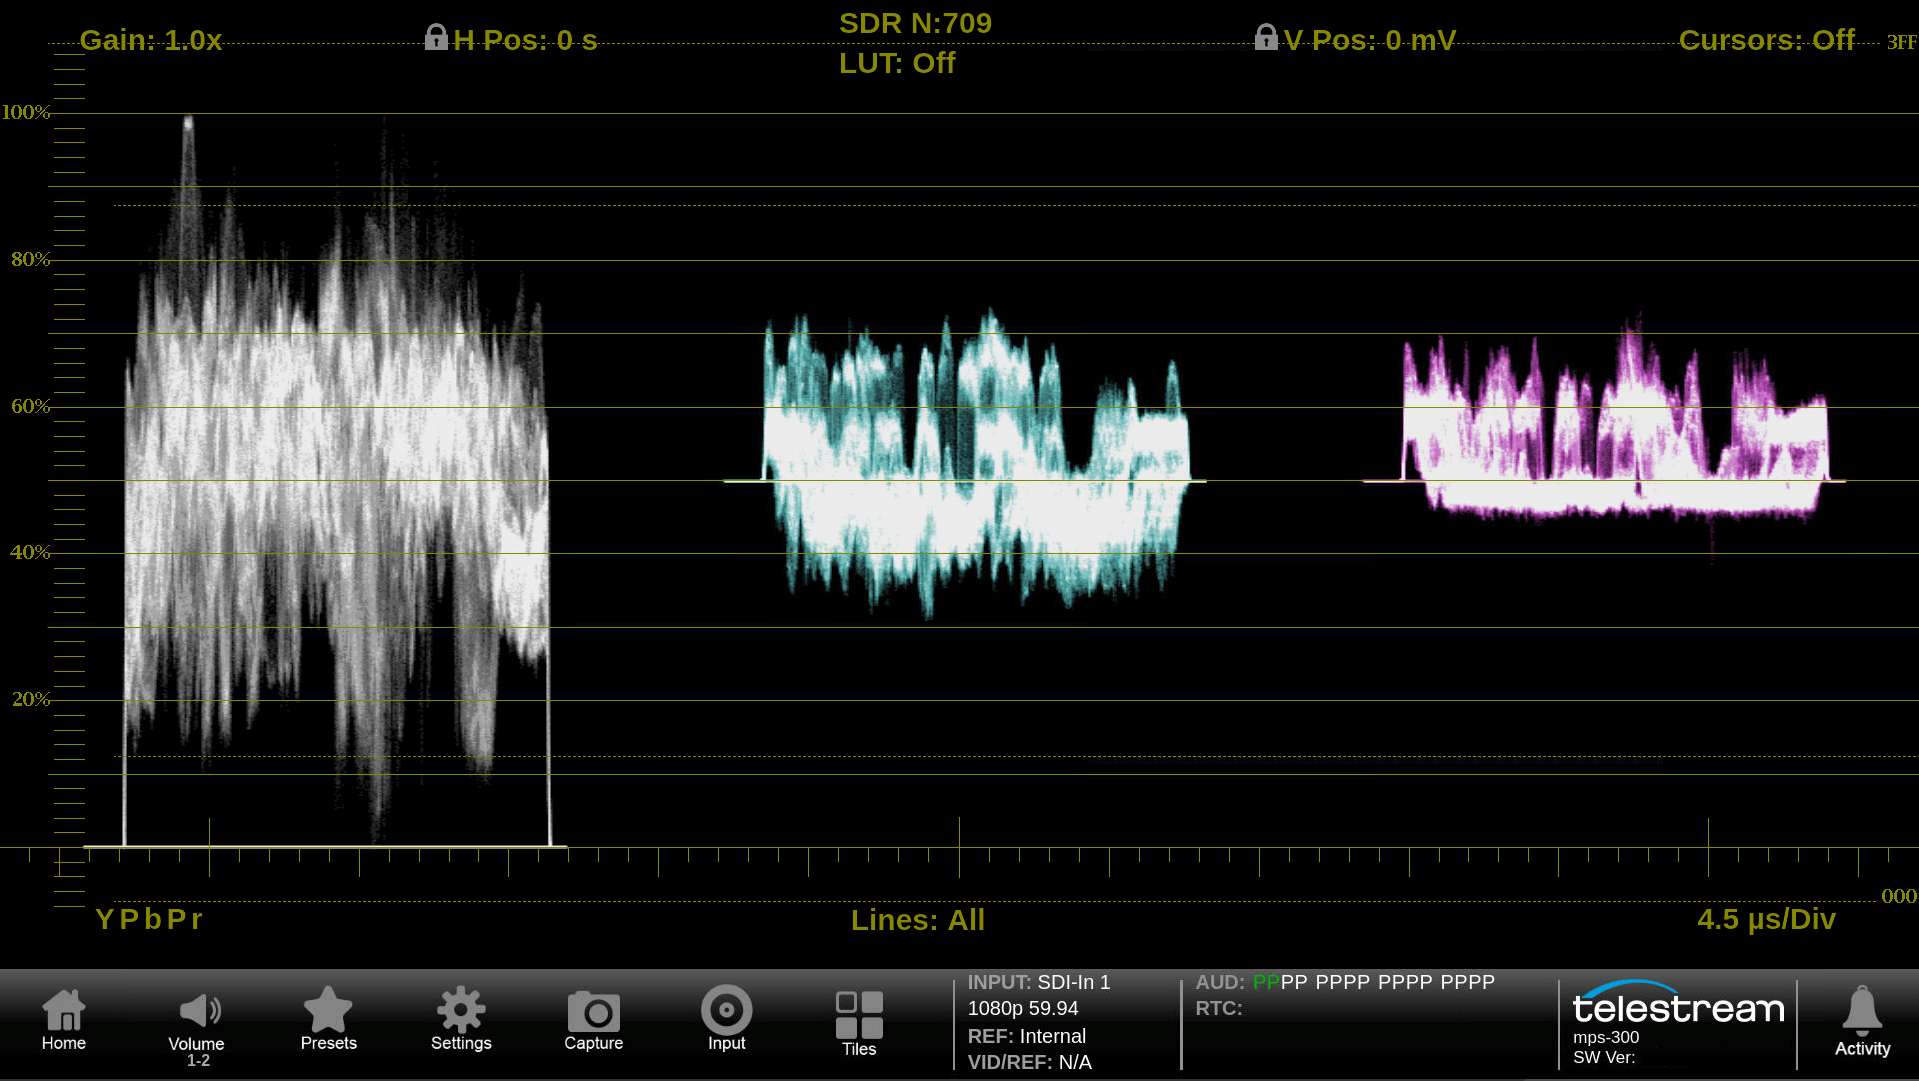
YPbPr waveform display to isolate difference between luma and color components. Color trace can be selected in application menu.
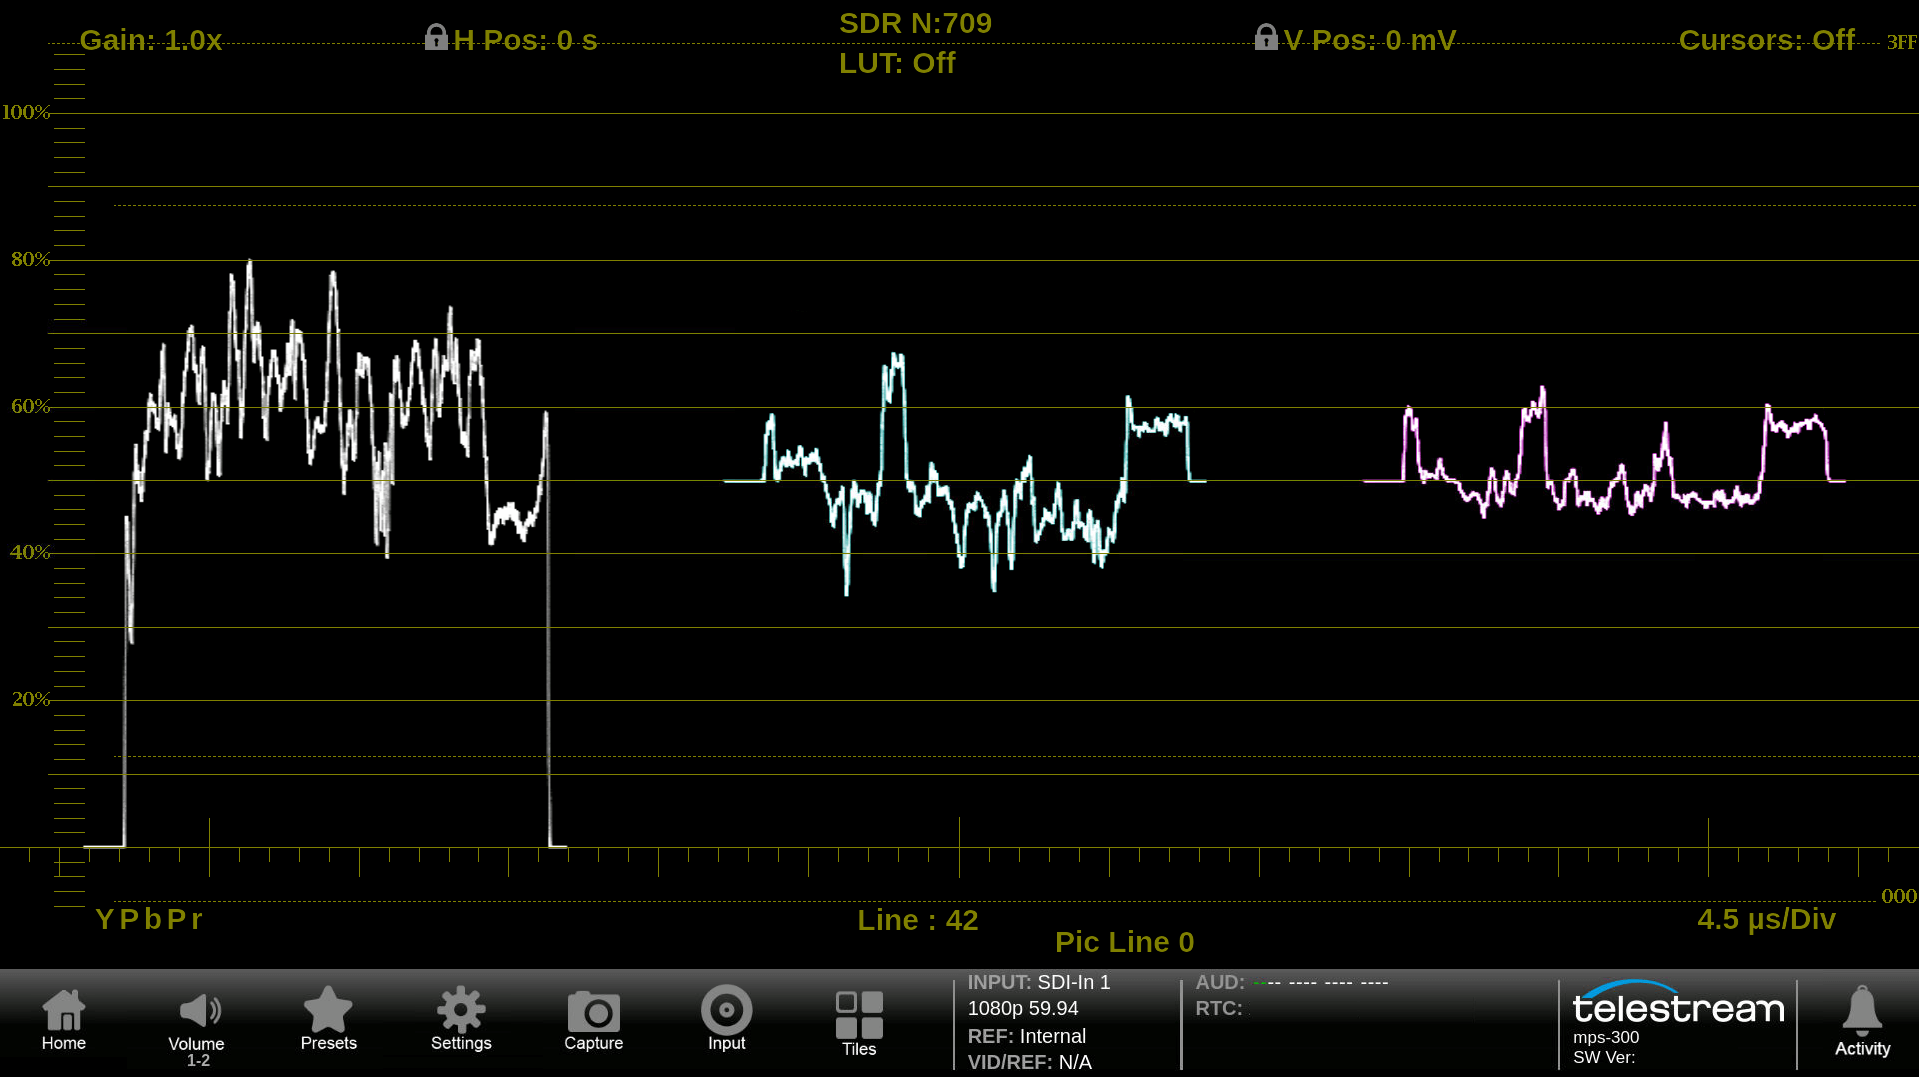
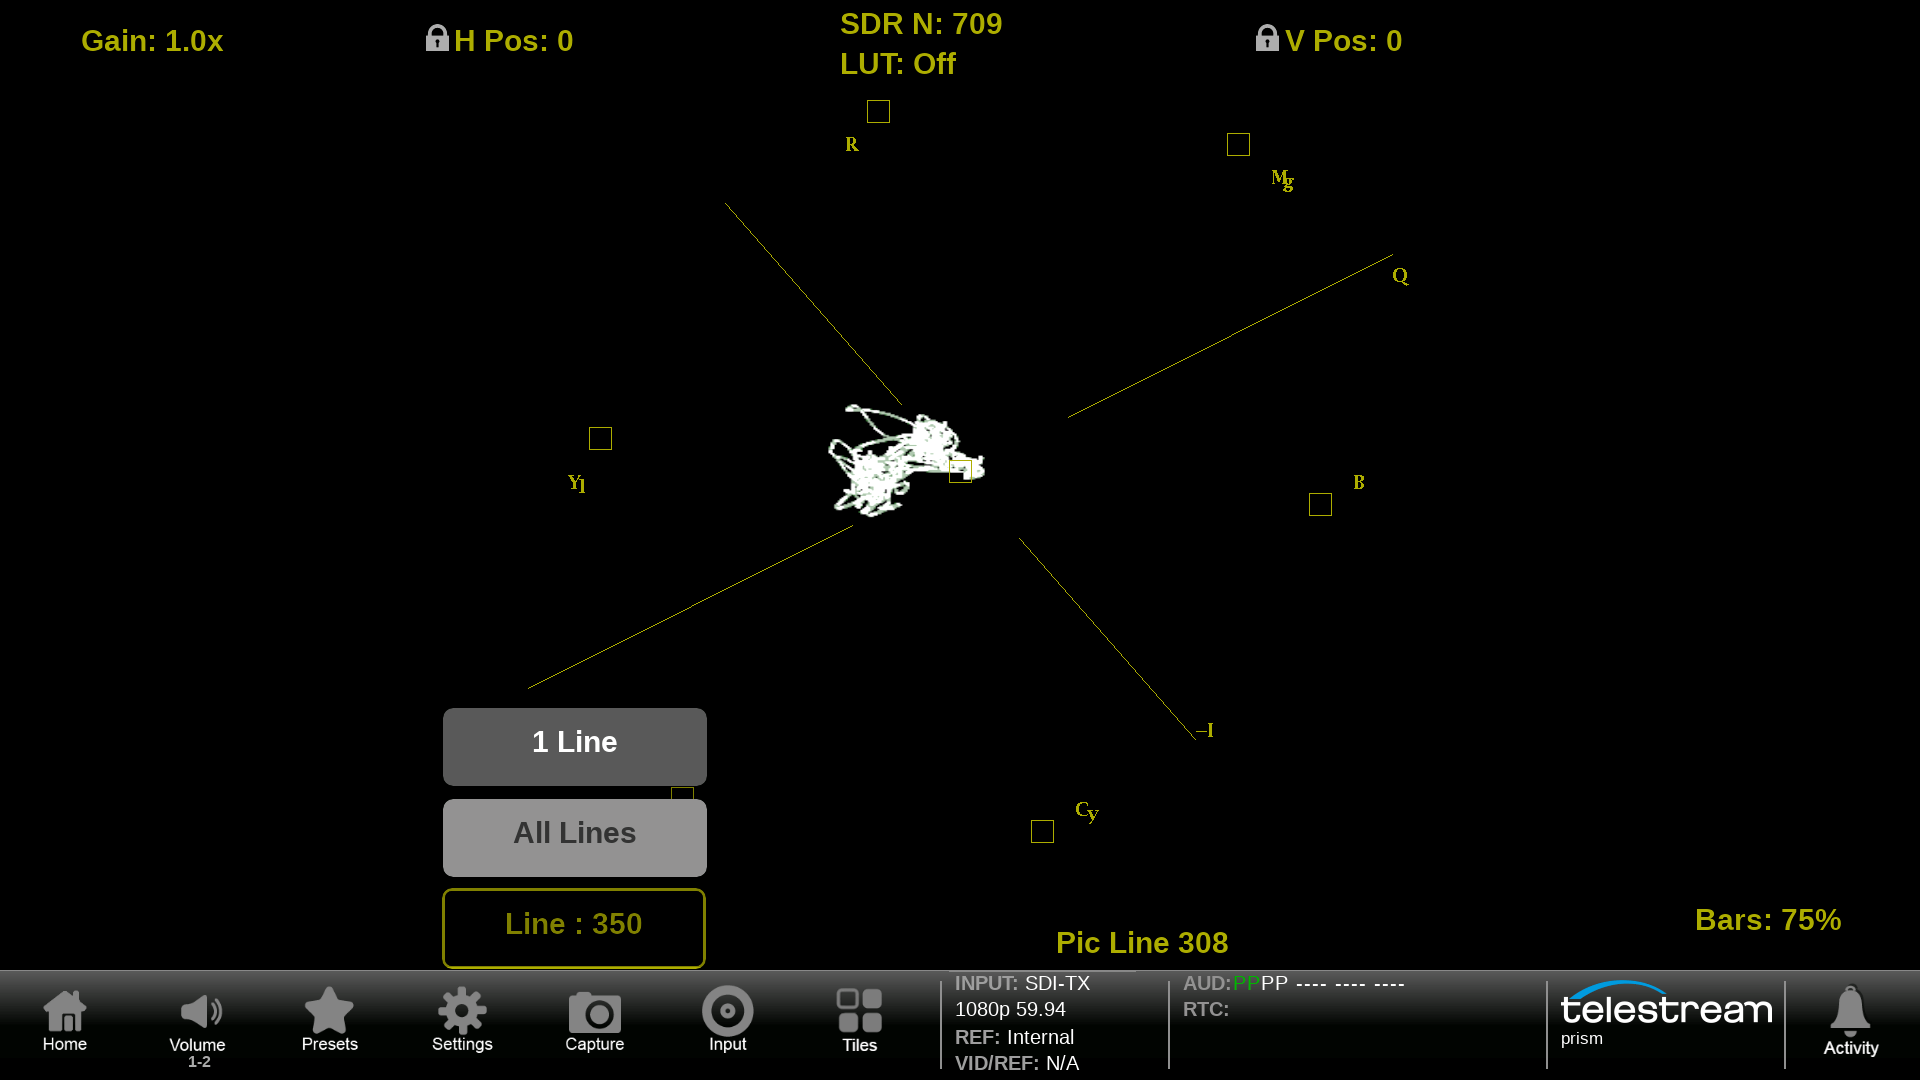
Precise adjustment using Line Select to isolate individual lines within the image.
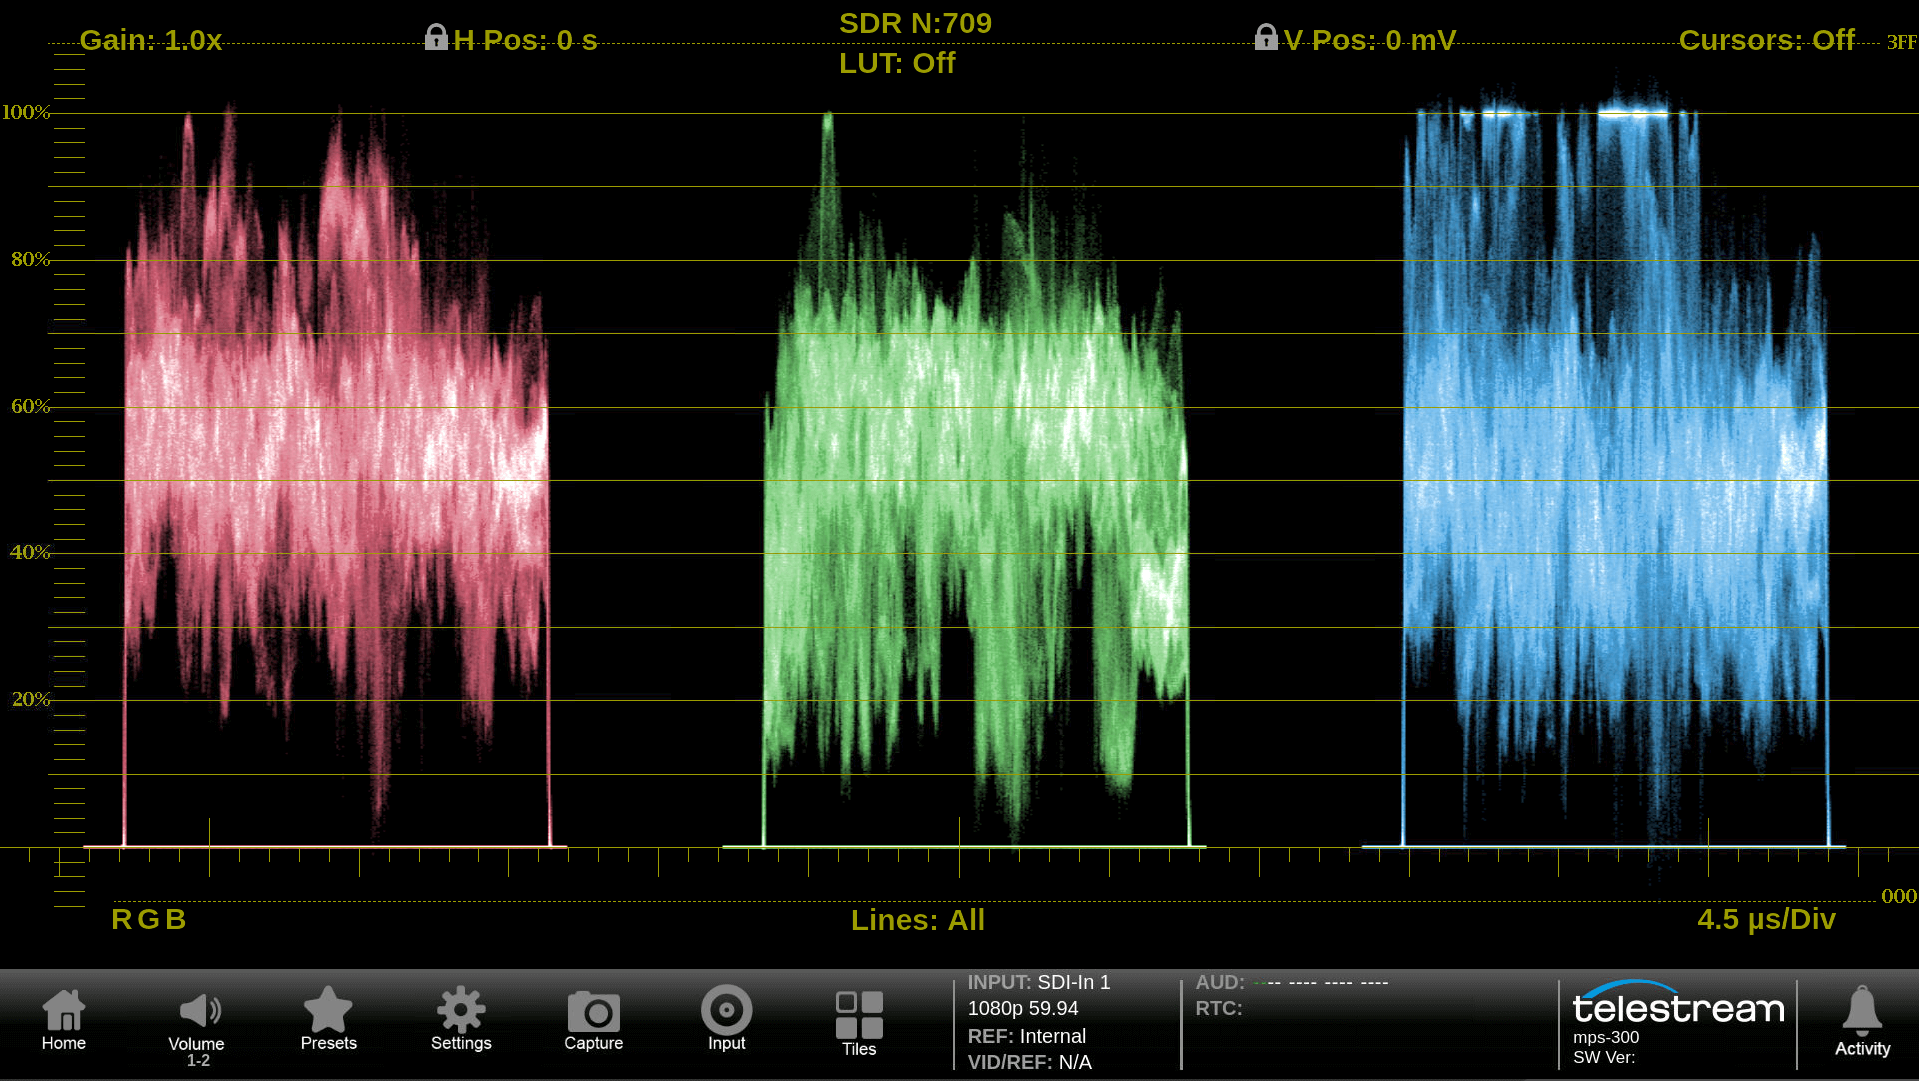
RGB or YRGB waveform display for camera shaders and colorists to make fine adjustments of the image.
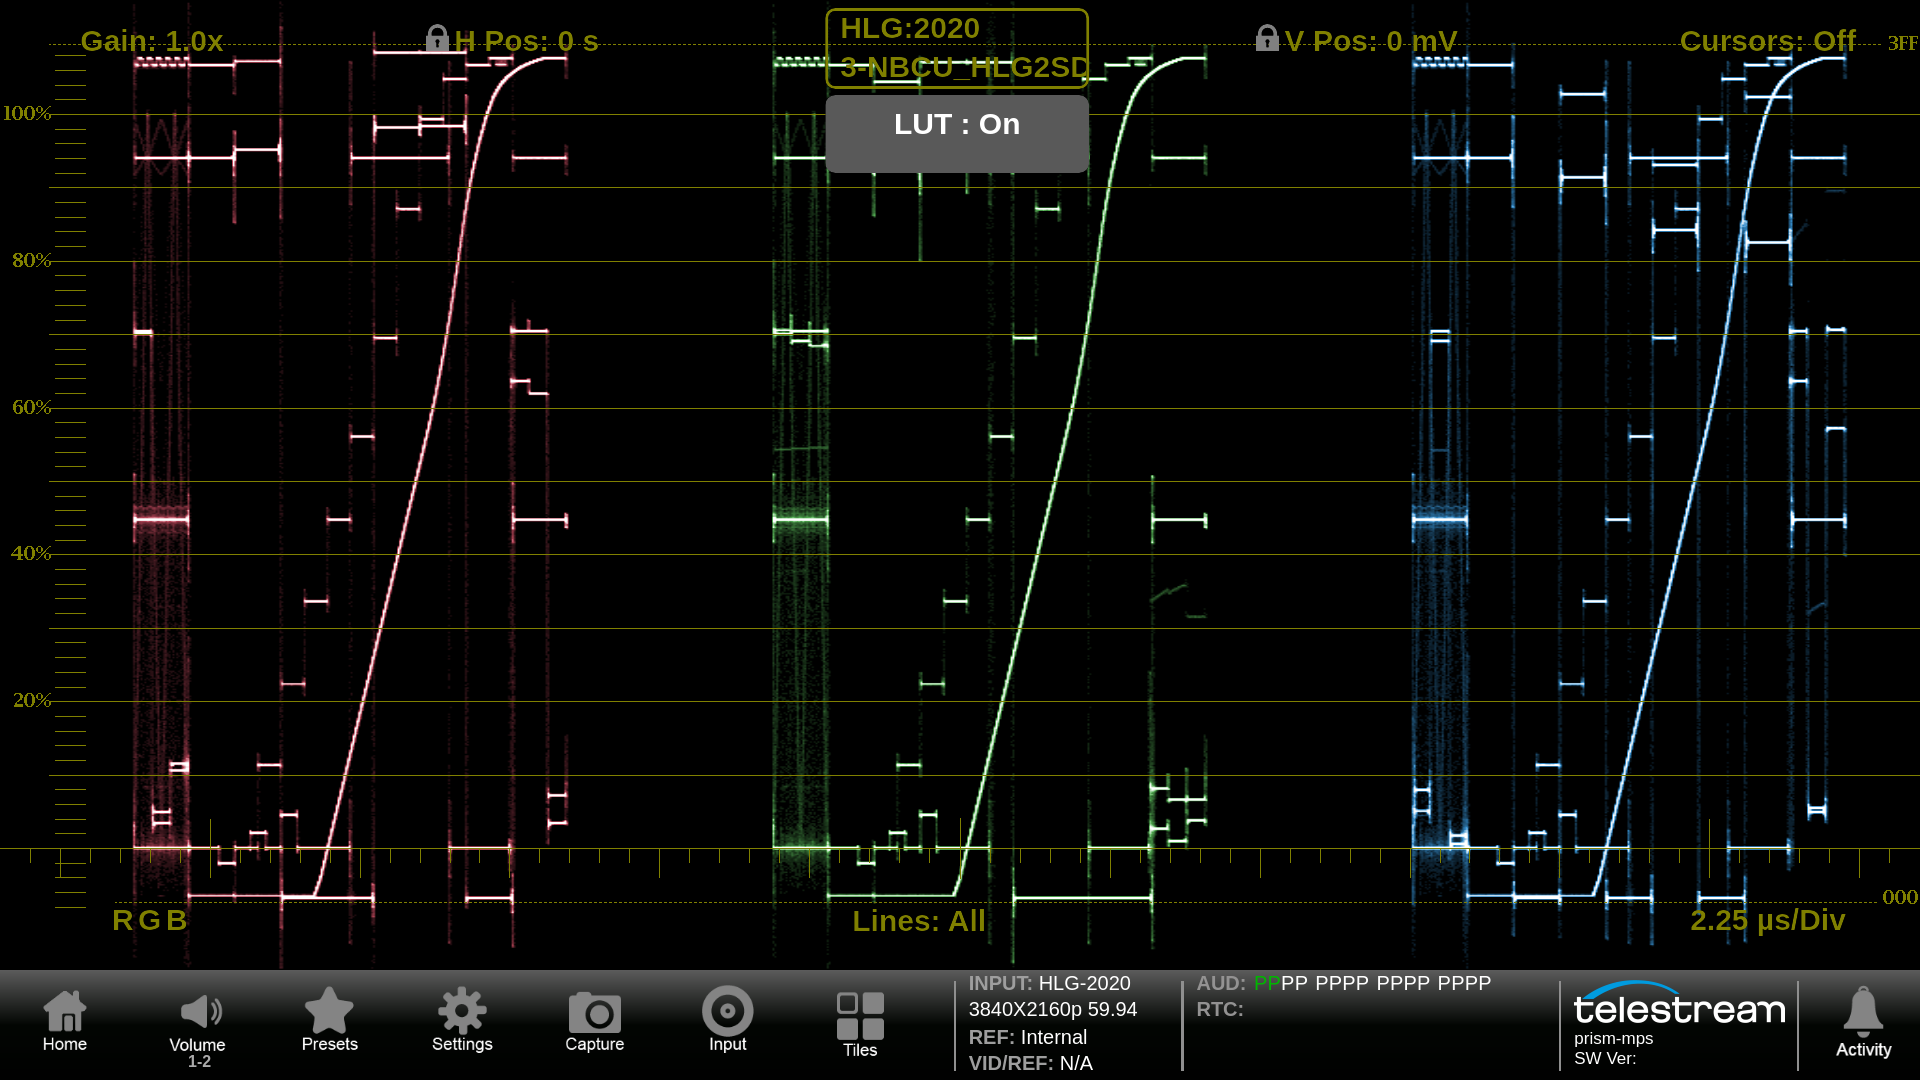
The User can import their own custom Look Up Tables (LUTs) into PRISM. These user configurable 3D LUT can be selected and applied to the waveform application.
With picture in waveform application the user can view both a picture and waveform display simultaneously within a tile. Using MULTI input the user can view four inputs of waveform and picture in a single PRISM display.
Using active only mode the trace width is aligned with the picture display width. This can help quickly identify objects within the picture display and correlated them with levels in the waveform display. Additionally, a timing pixel cursor can be used within the waveform display to help with location of the object and line select can be enabled in the picture display to determine line and sample location.
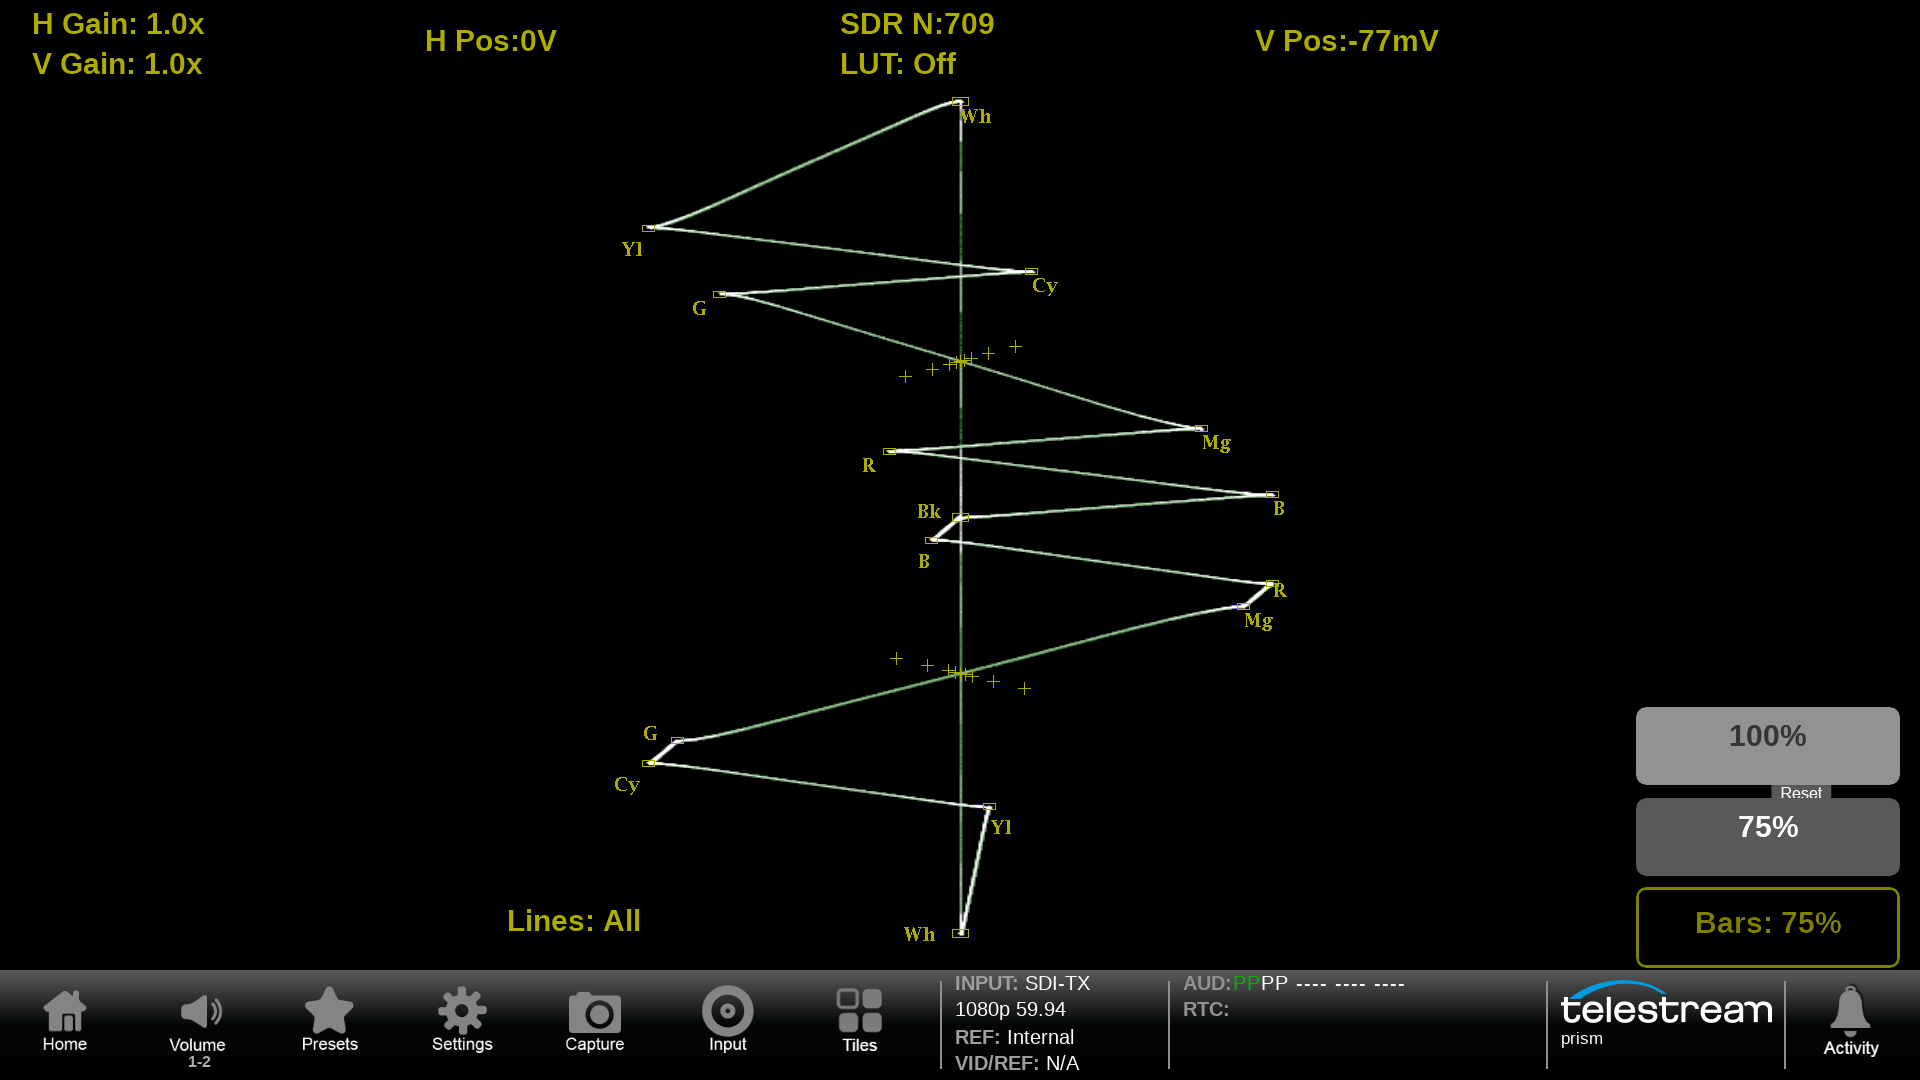
Vector
Allows the user to adjust the Saturation and Hue of the color components with adjustment of Gain, Line Select or bar format (100% / 75%).
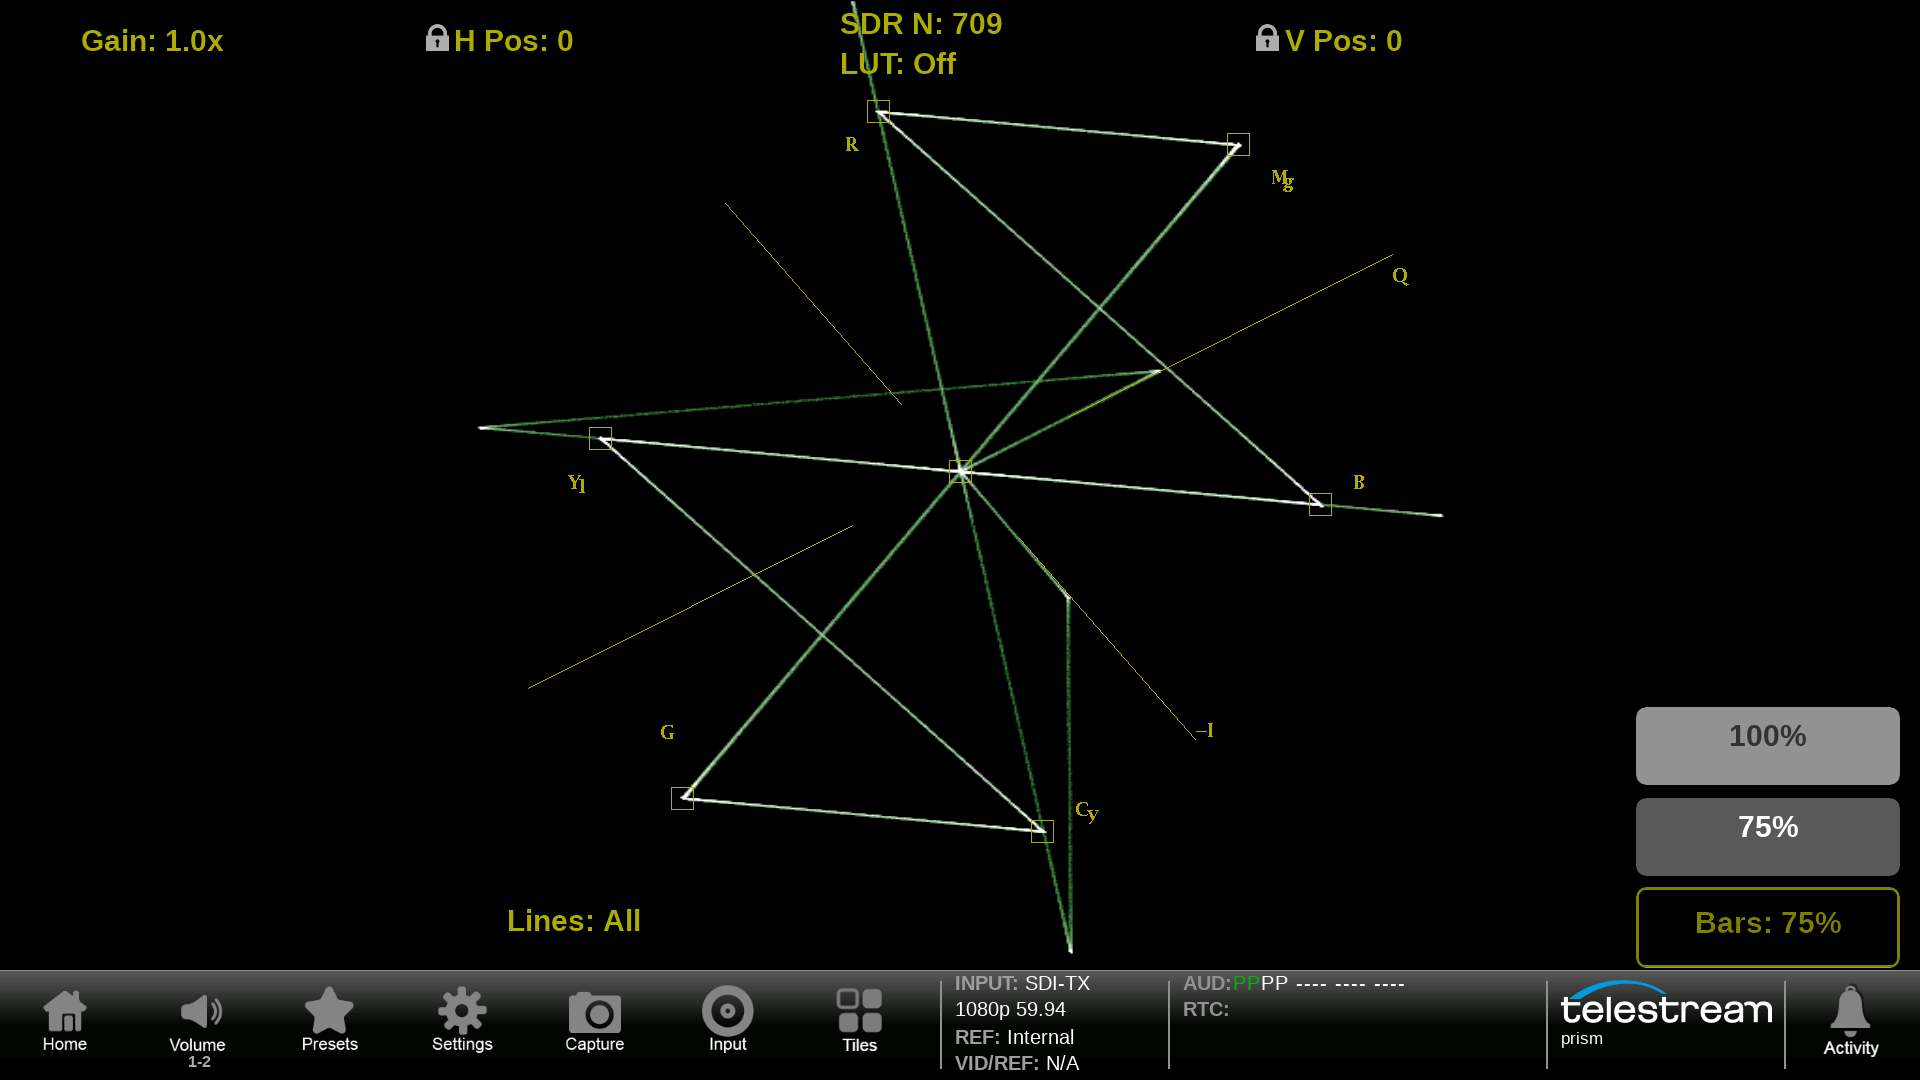
Selectable Bar Format for 75% and 100% Graticules with input selection for chromaticity of 709 or 2020.
Precise adjustment using Line Select to isolate individual lines within the image.
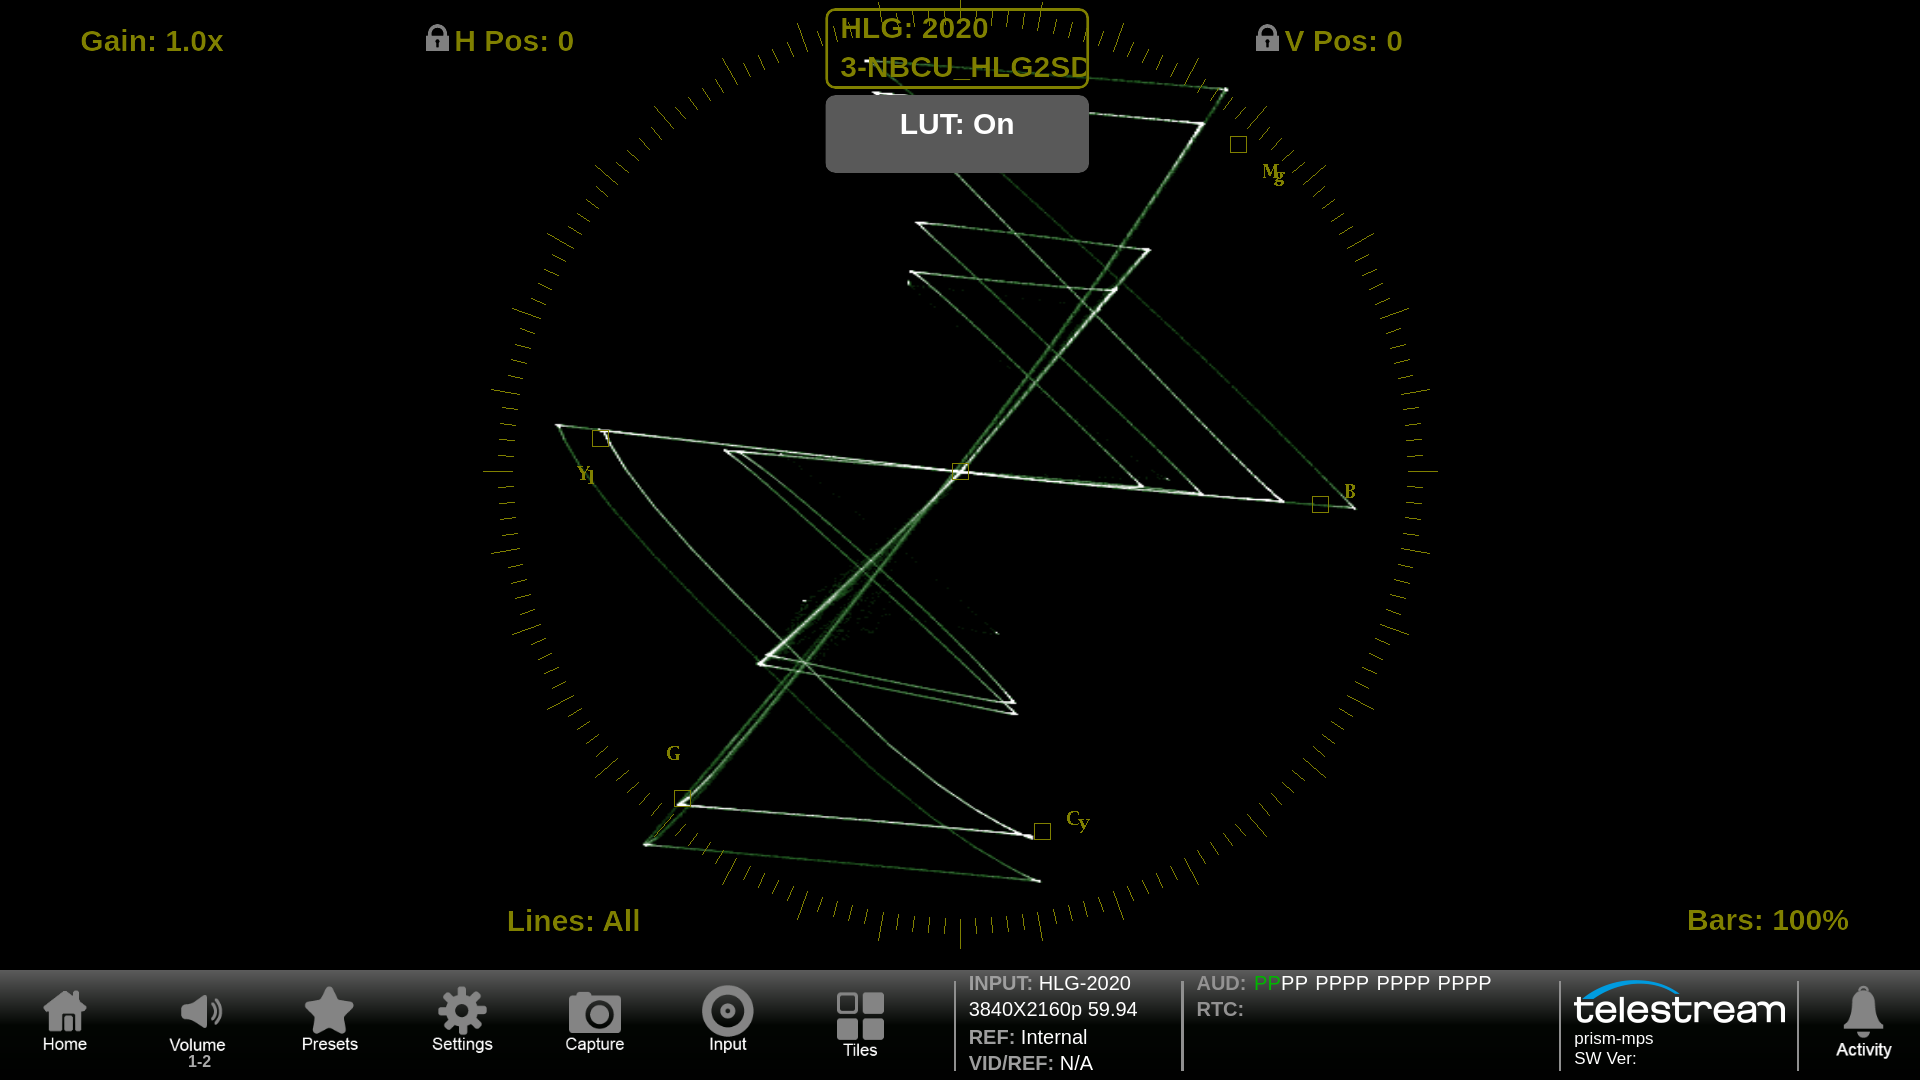
The User can import their own custom Look Up Tables (LUTs) into PRISM. These user configurable 3D LUT can be selected and applied to the vector application.
Lightning
Telestream’s Lightning display provides an intuitive X-Y plot of the YPbPr component signal with Y versus Pb in the upper half of the display and -Y versus Pr in the lower half of the display.
Using a simple color bar test pattern 75% or 100% should align within the appropriate graticule boxes.
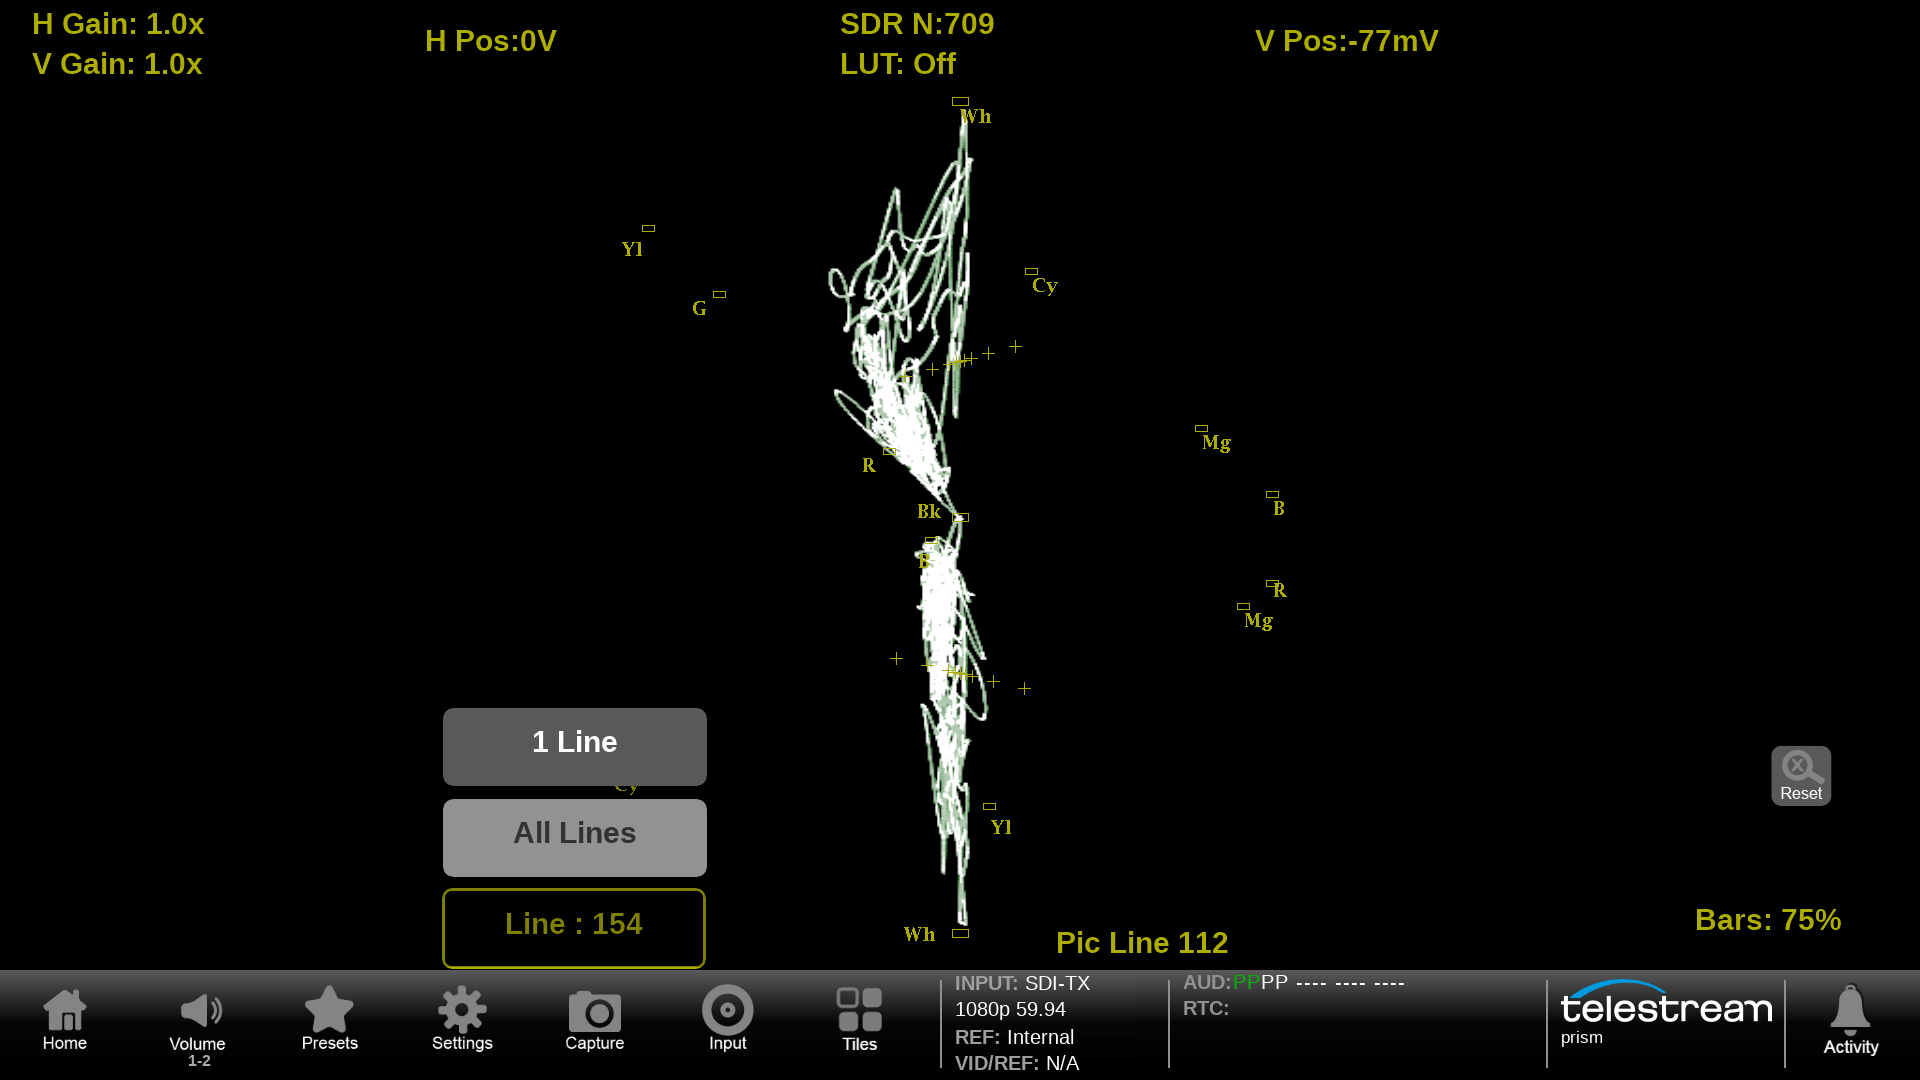
Use Line Select to isolate and individual line within the image.
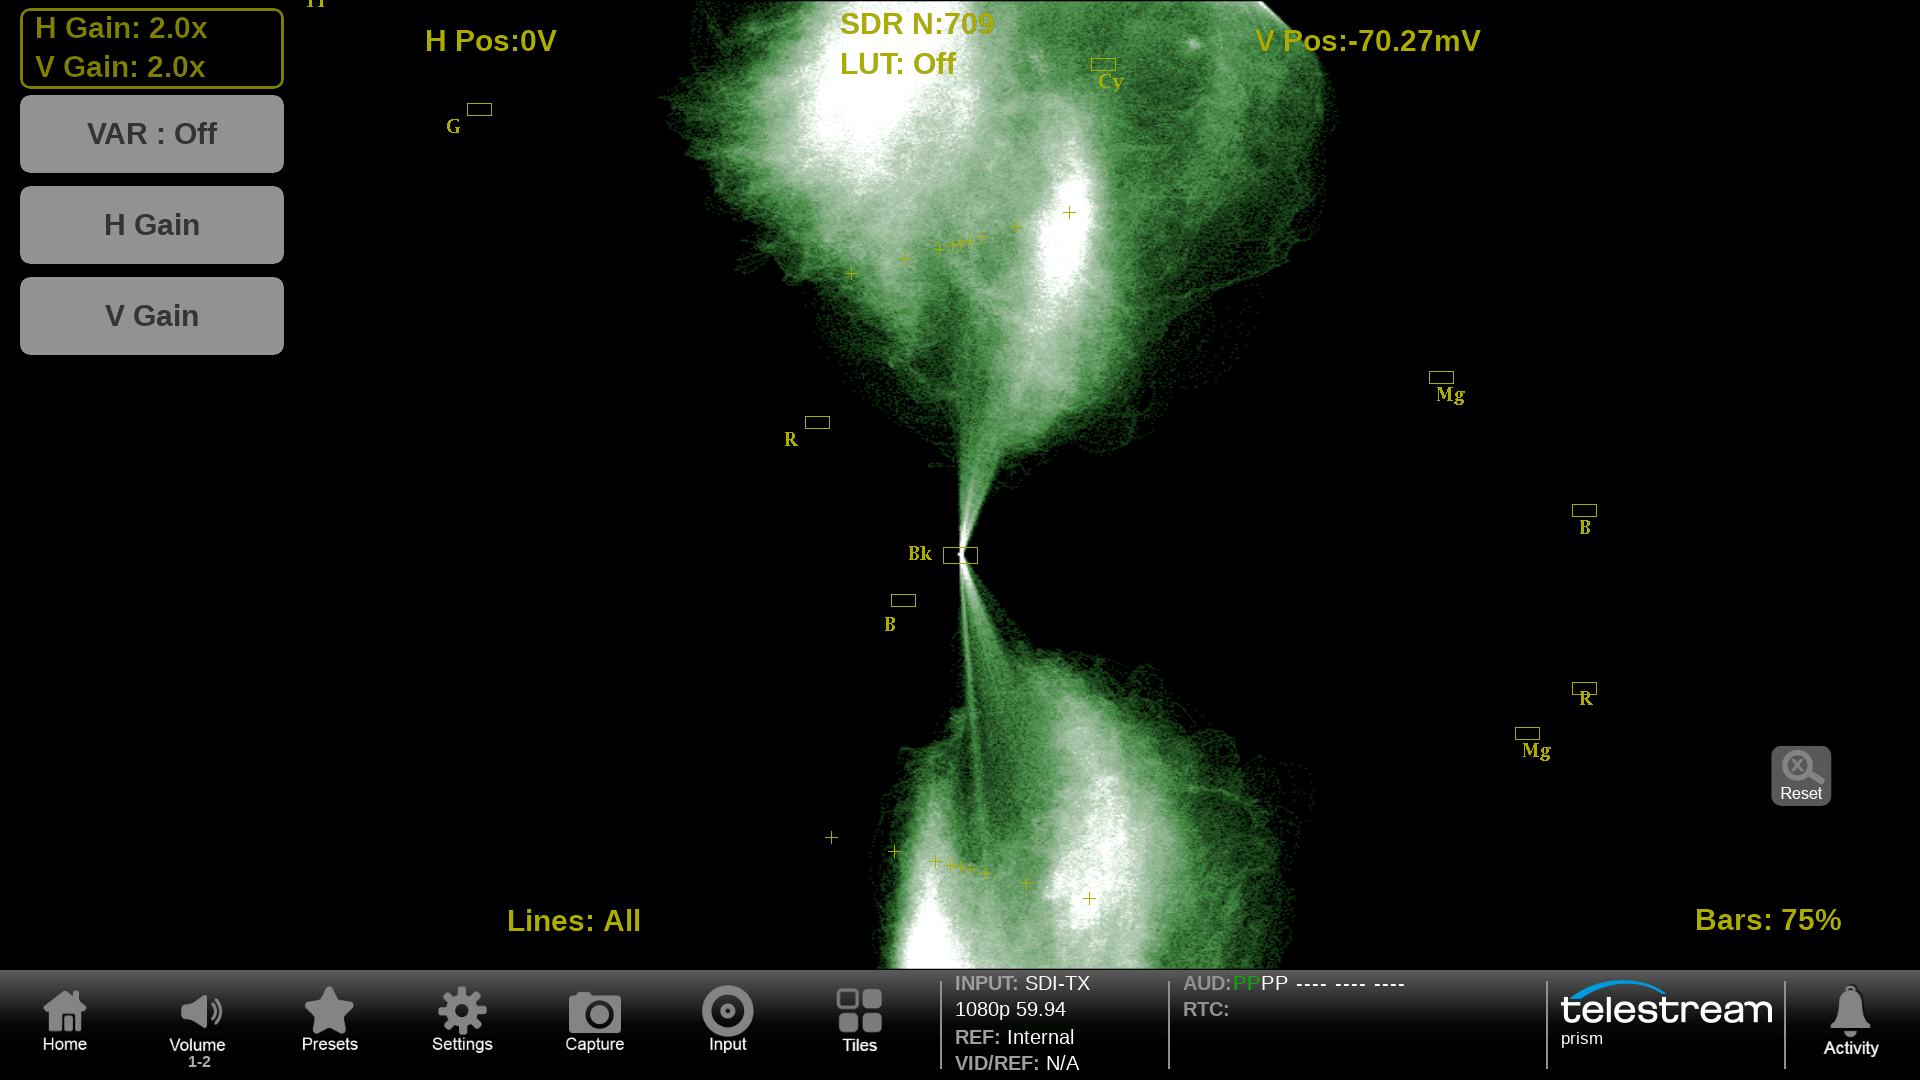
Gain and MAG adjustment allow for adjustment of color offset in the blacks at the center of trace.
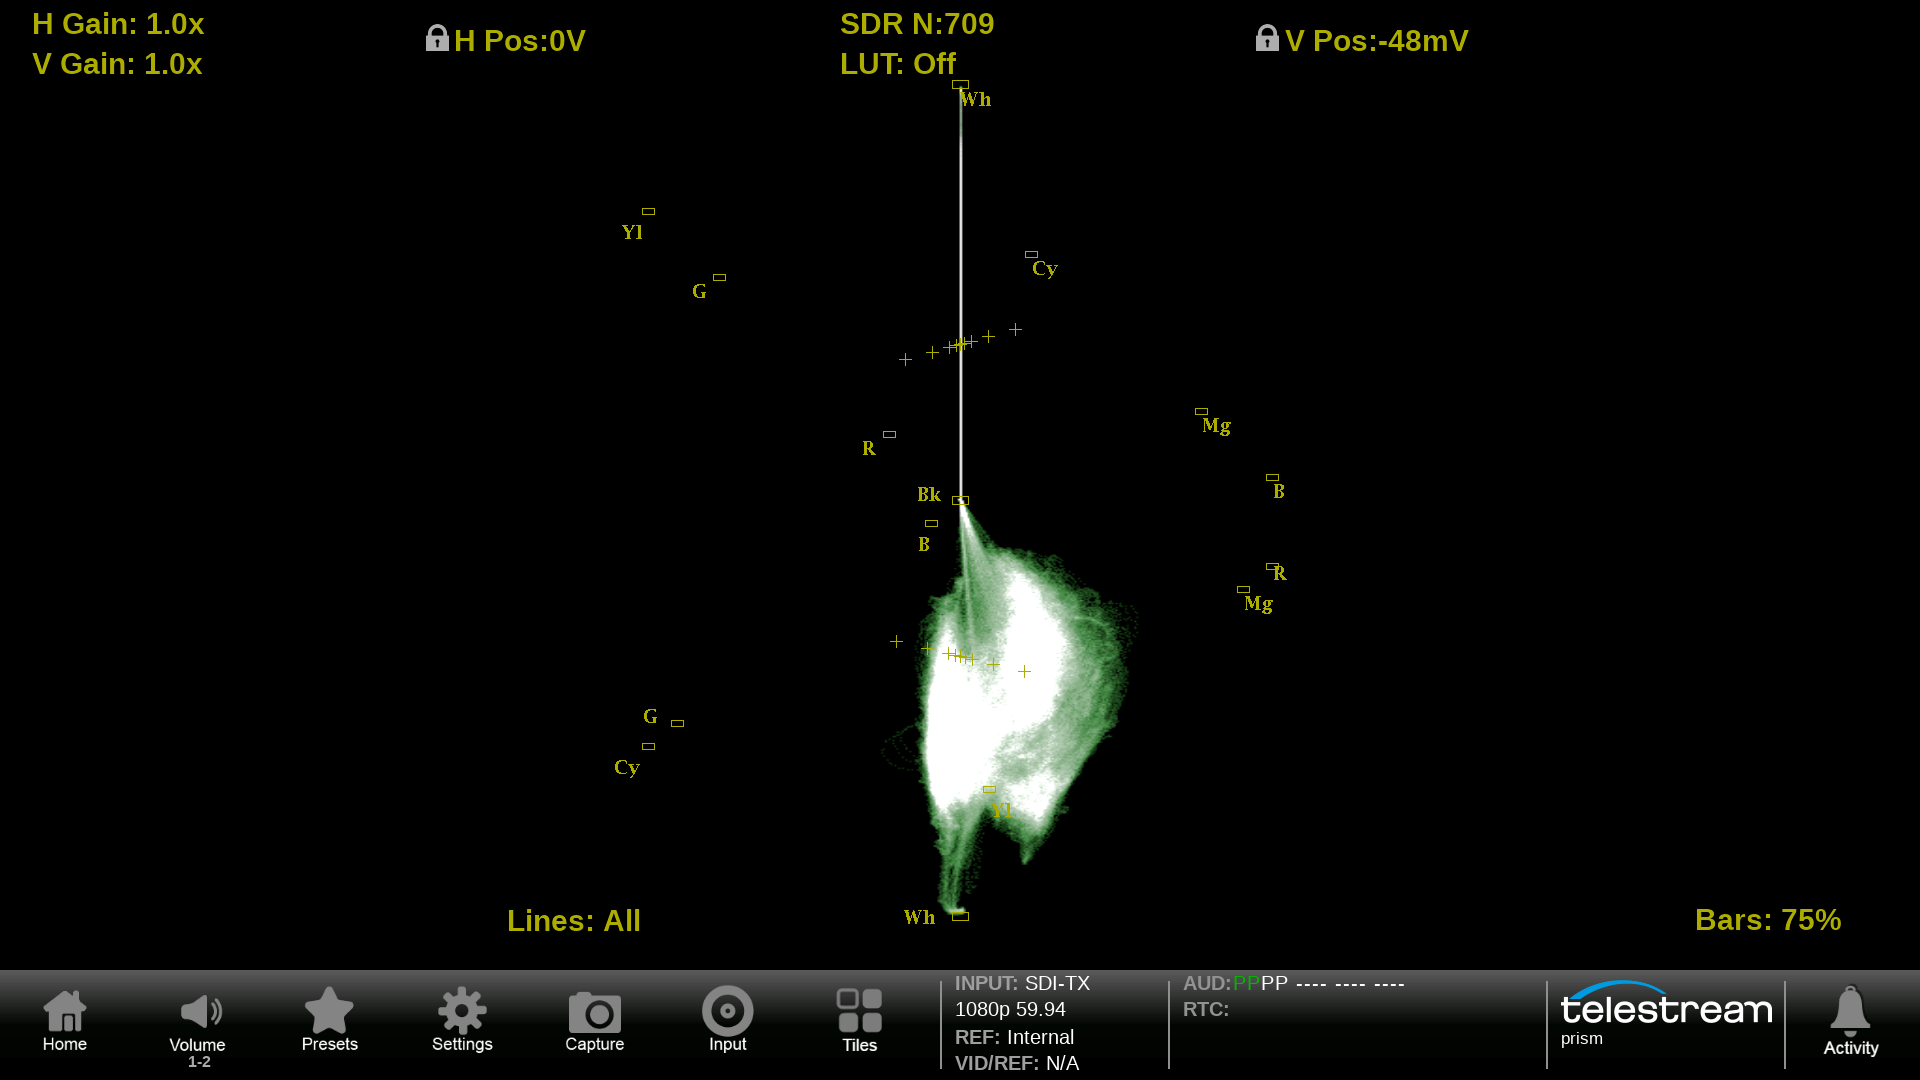
Easily identify the color component with Pb in the upper half and Pr in lower half. With luma in the vertical axis and chroma in the horizontal axis. In this case the Pb component is missing.
Using color bars a bending of the Green Magenta transition can indicate an inter-channel timing error within a specific component of the signal.
With a camera grey scale chart a deviation in the lower half of the display shows a red offset in the image.
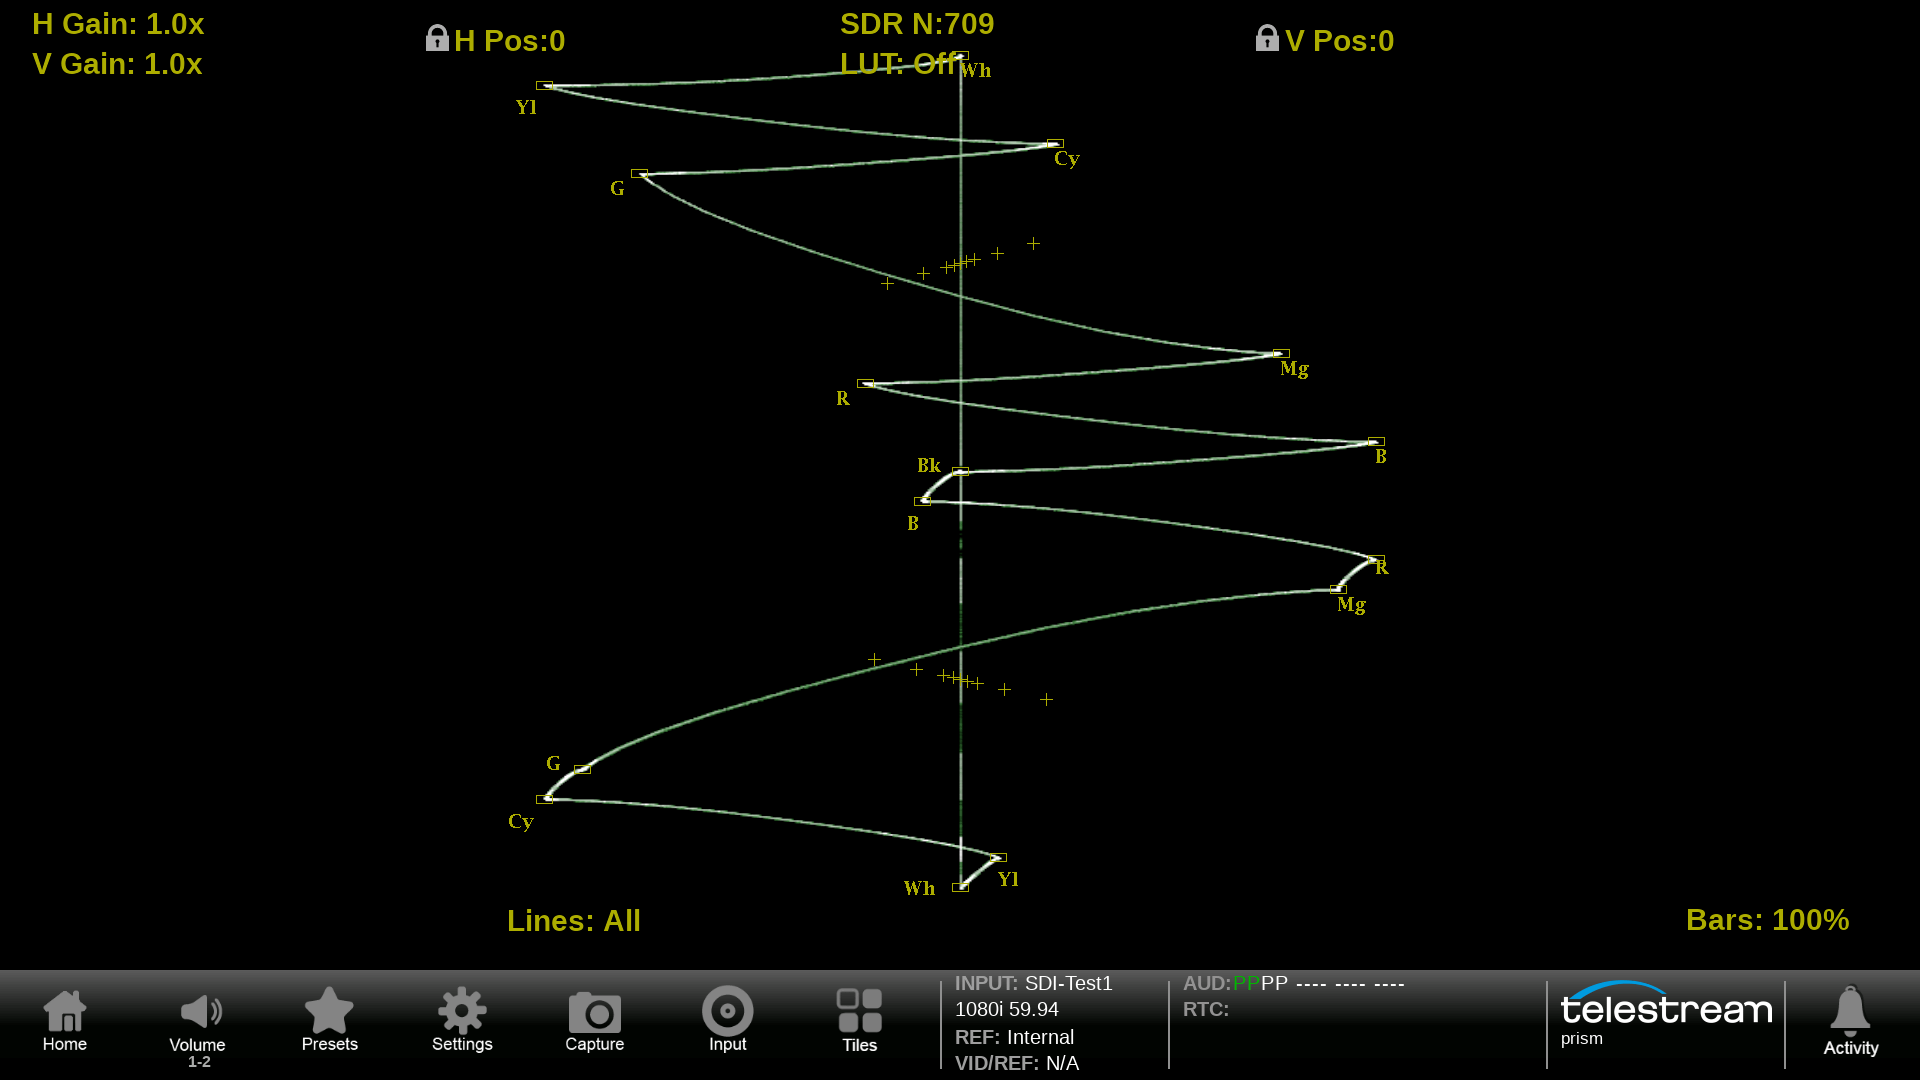
Diamond
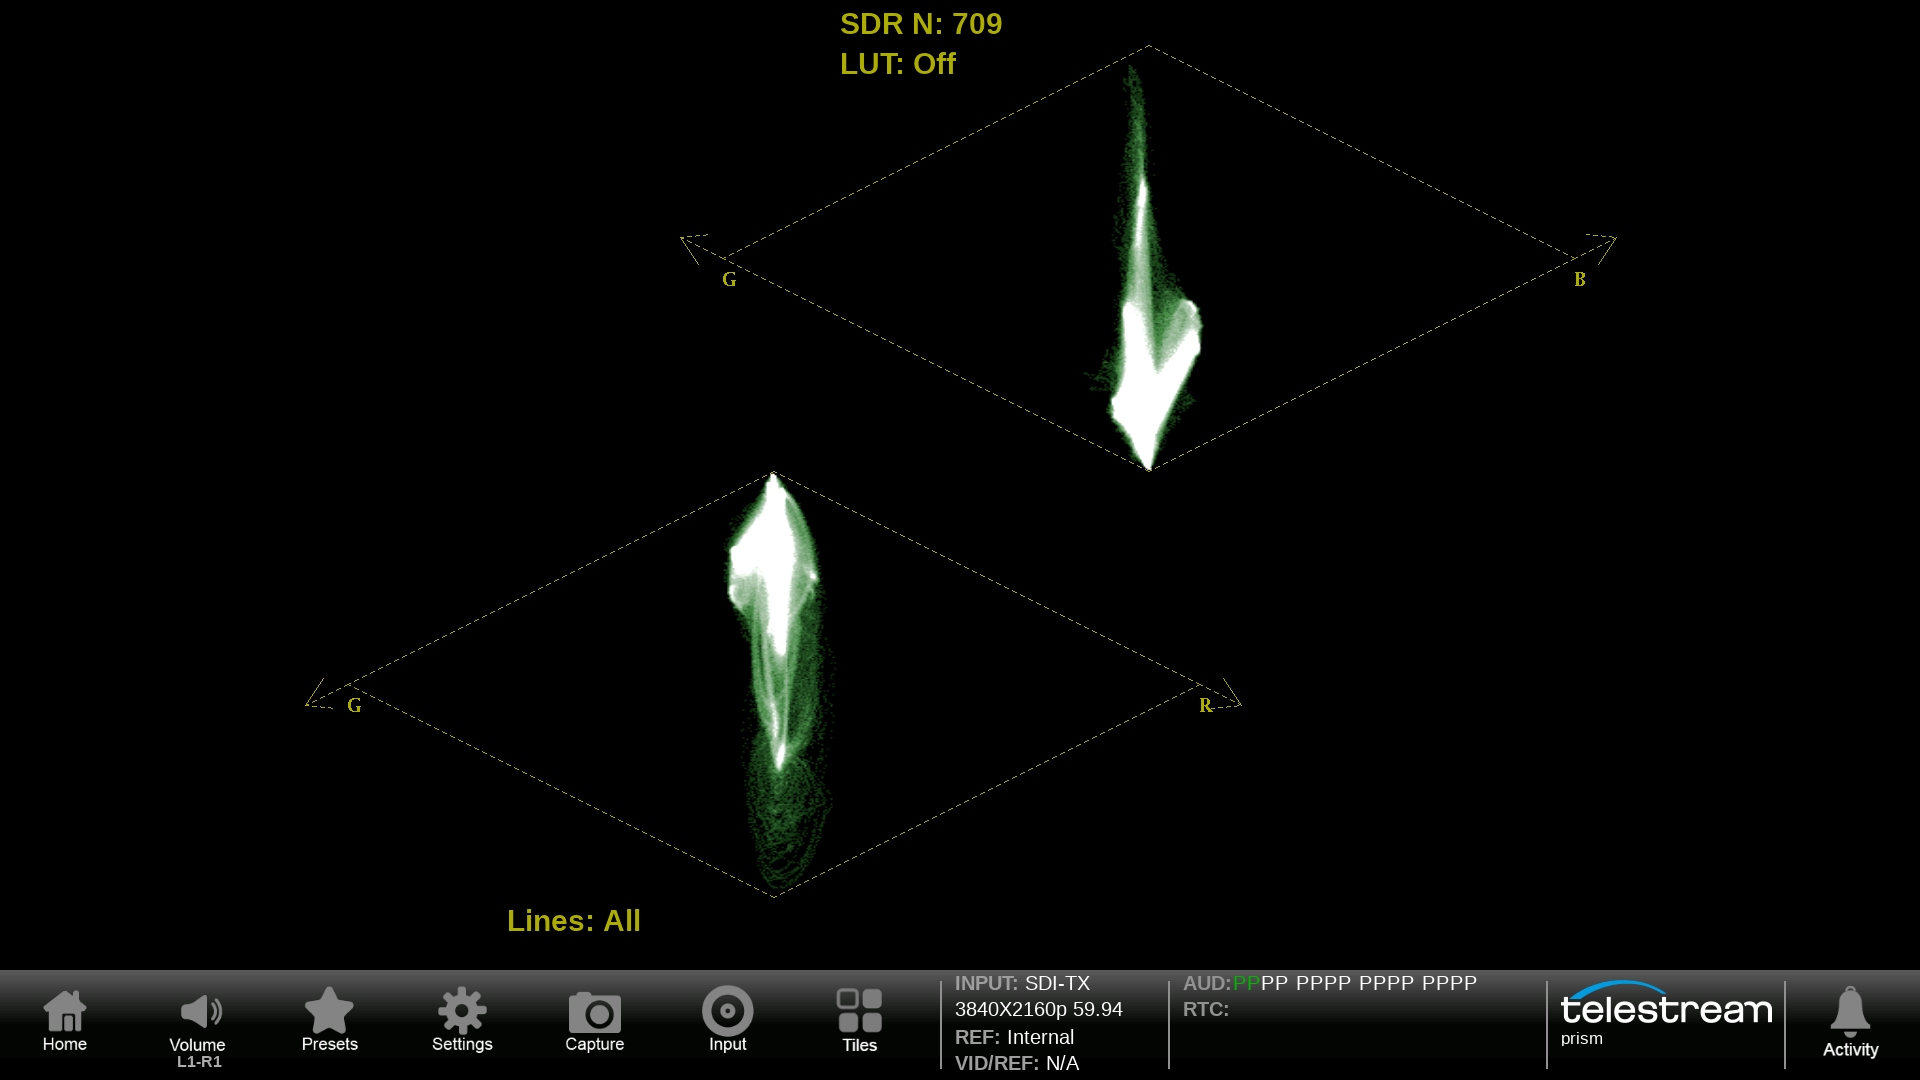
Telestream’s Diamond display provides an intuitive X-Y plot of the RGB component signal with G versus B in the upper half of the display and -G versus R in the lower half of the display.
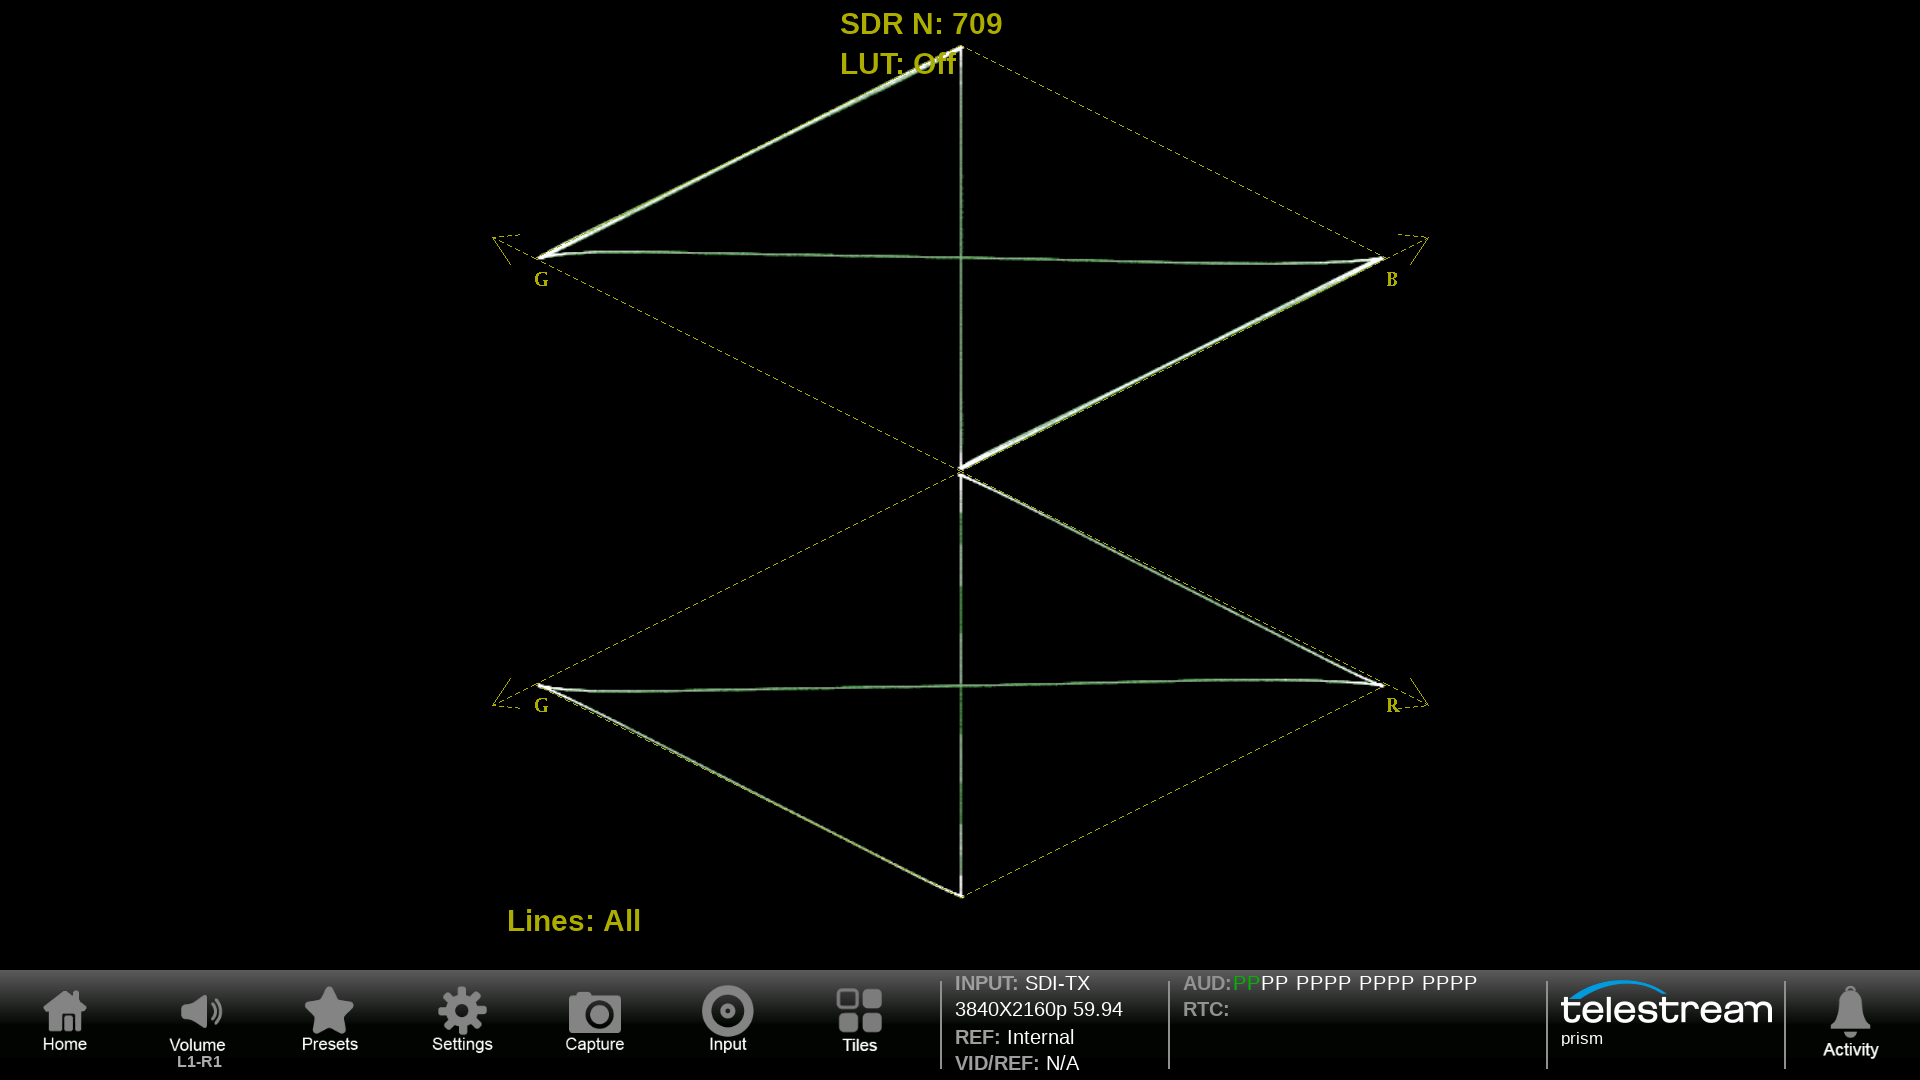
Diamond display for monitoring of RGB component signal for Camera Shading and Editors/Colorist with 100% color bars applied.
Split Diamond display that allows the user to see the offset in the black of the RGB color components.
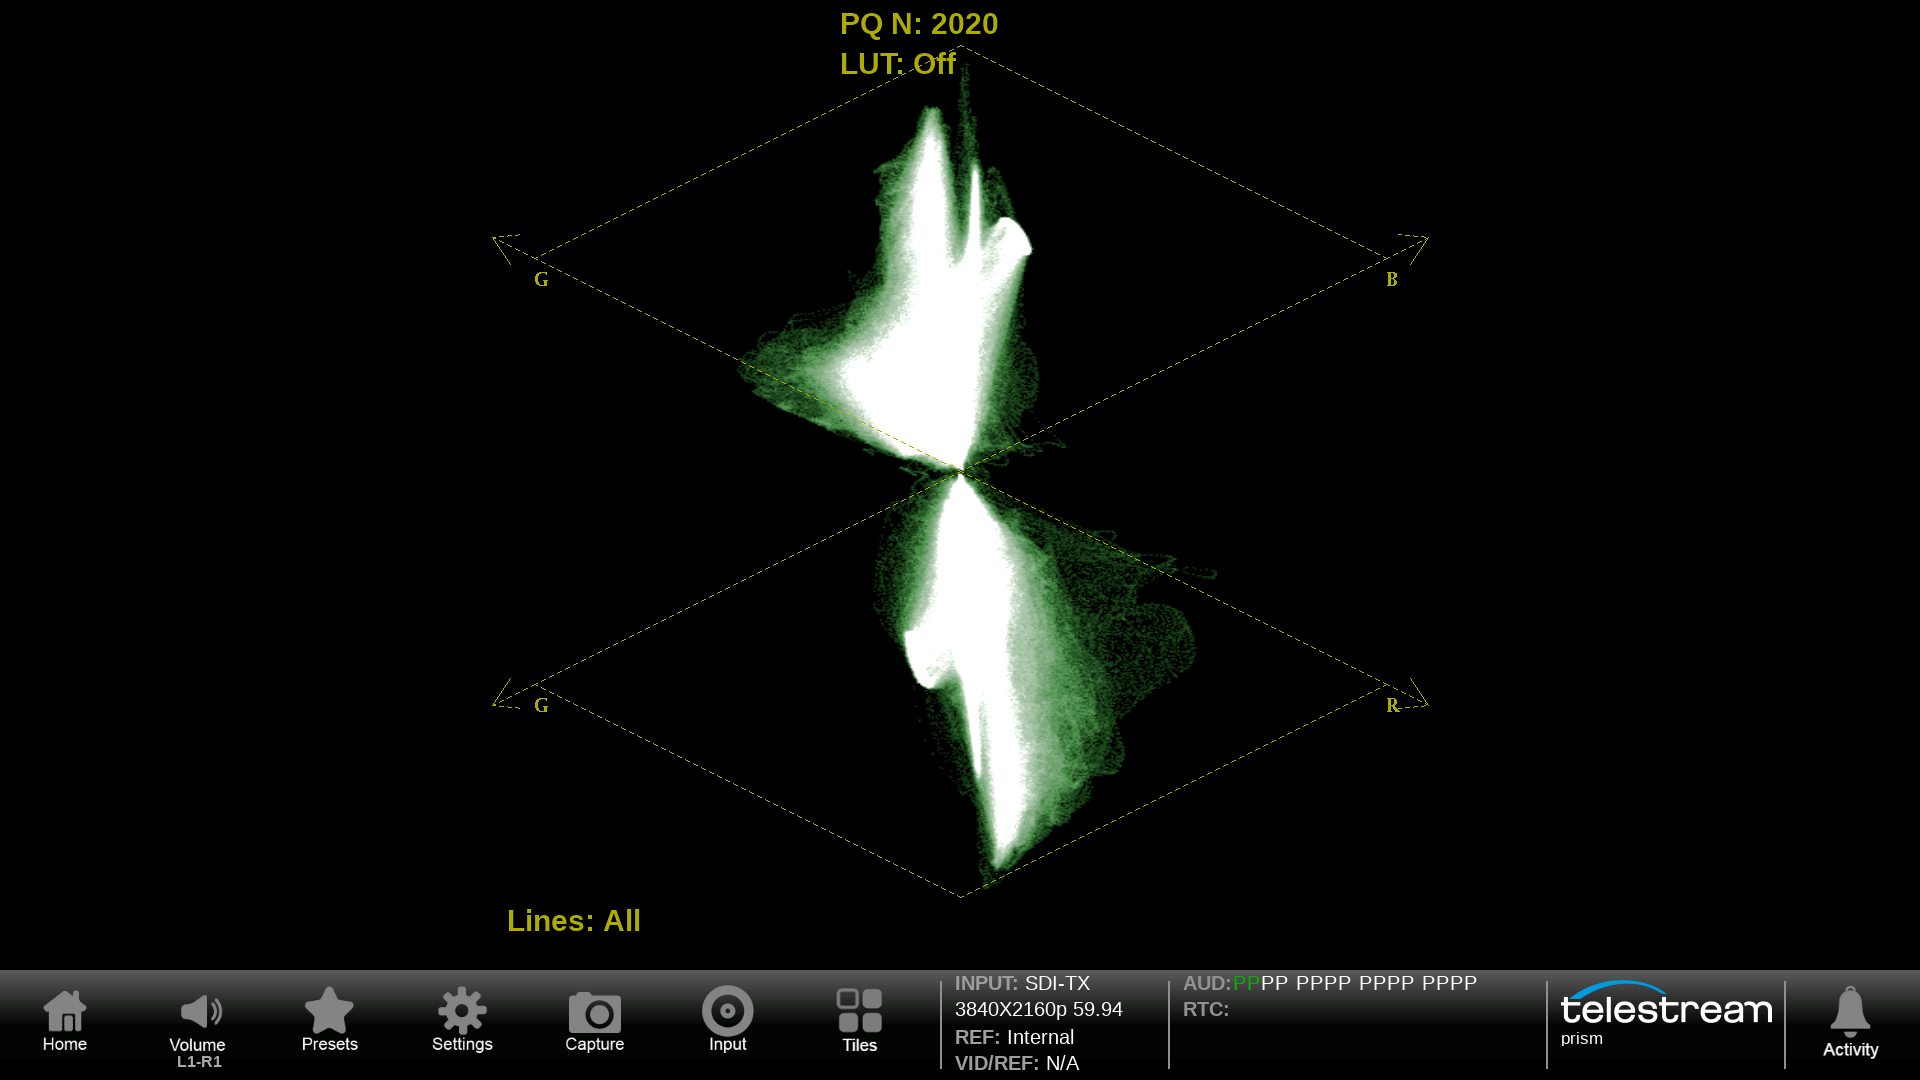
Diamond display for monitoring of RGB component signal for Camera Shading and Editors/Colorist using a live signal.
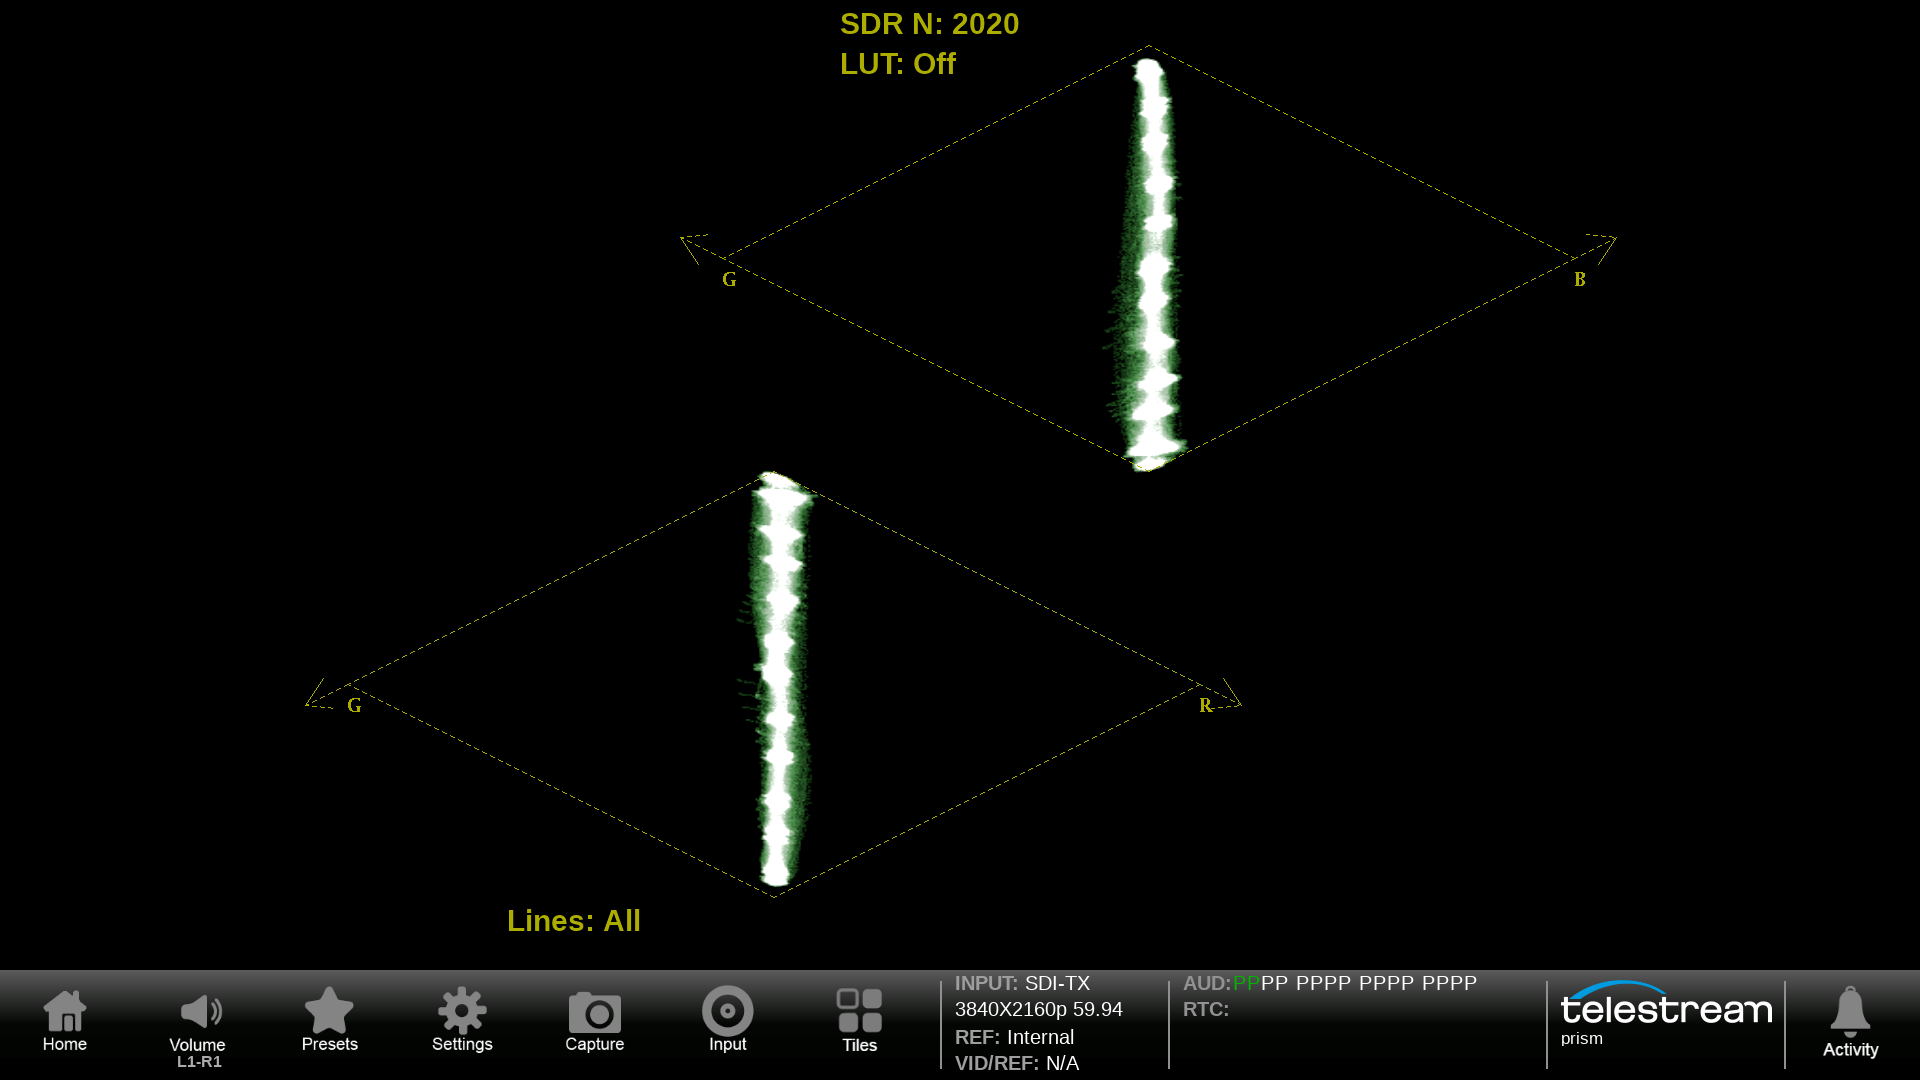
Luma signals should be a vertical line from the center black to the outer apex. Here we are using a greyscale camera chart that is luma balanced.
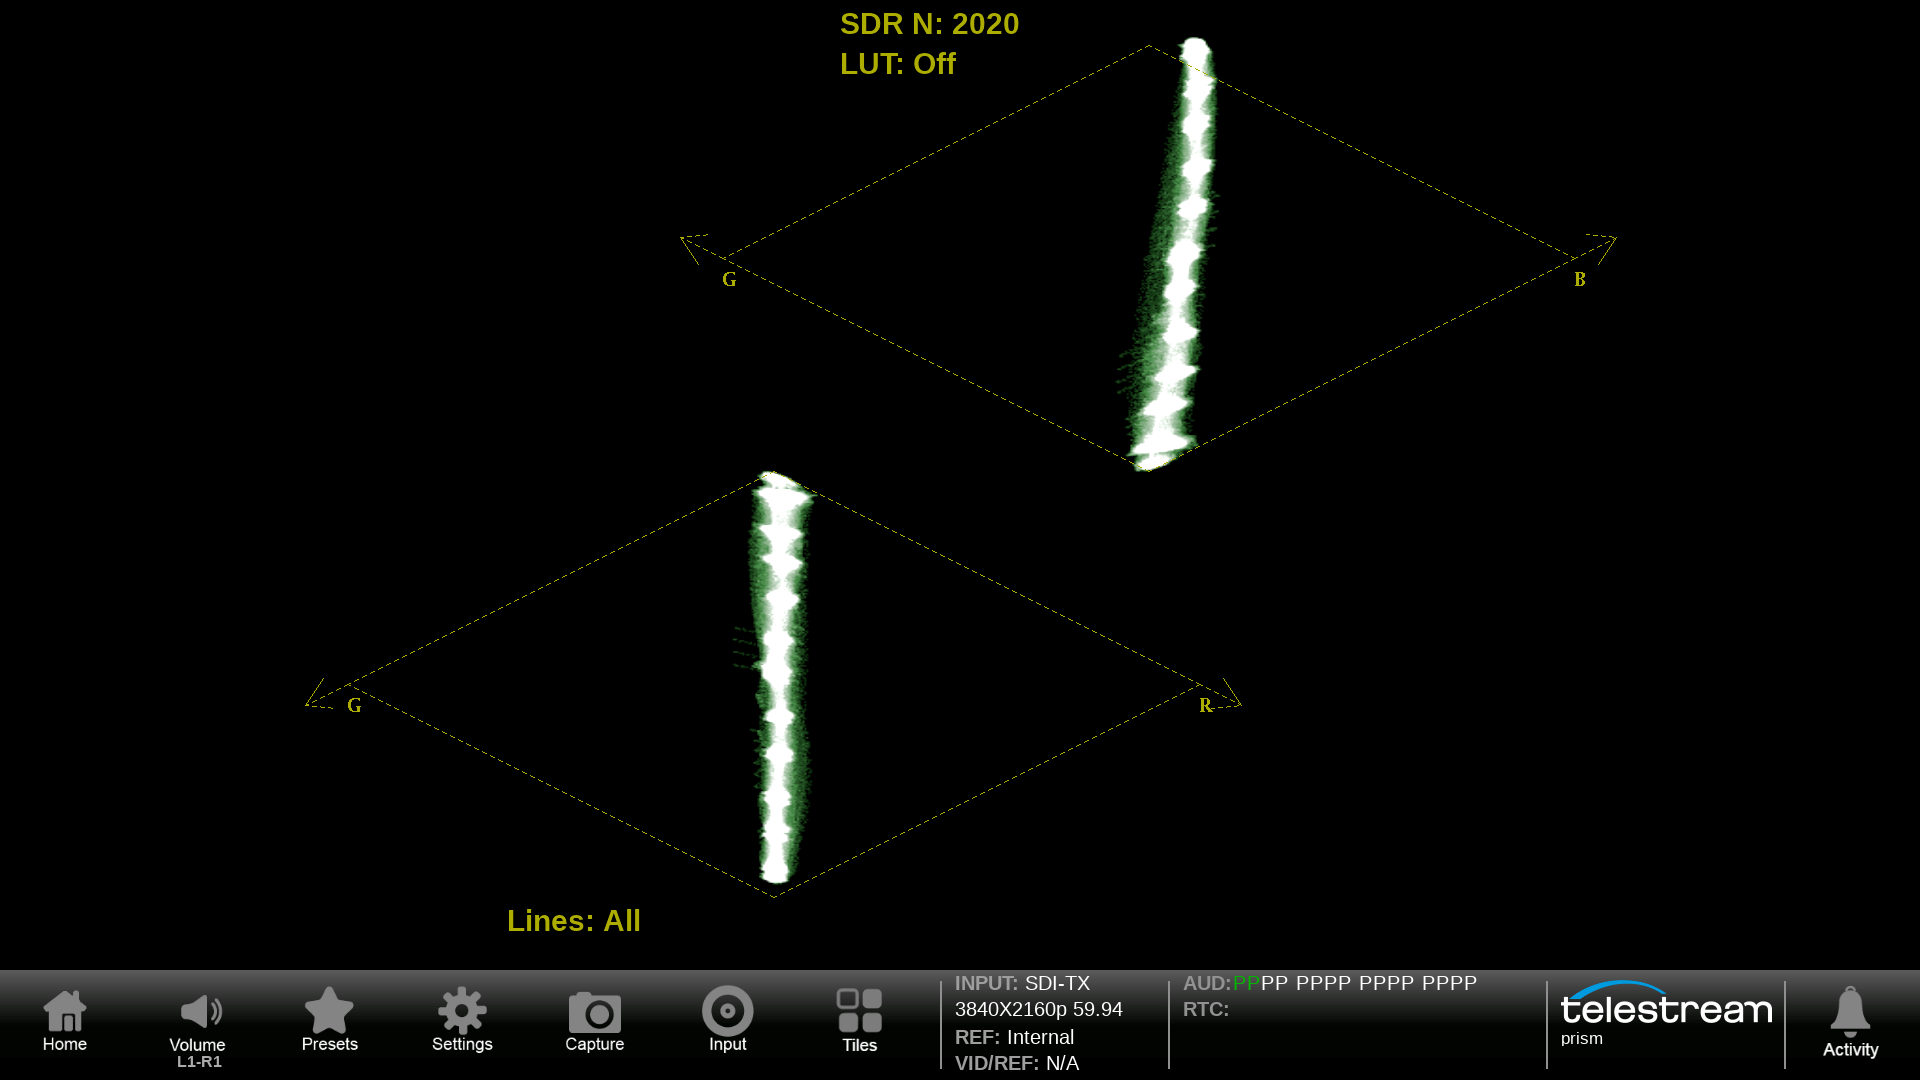
In this example a blue offset has been added to the camera greyscale chart cause a deviation in the upper half of the trace.
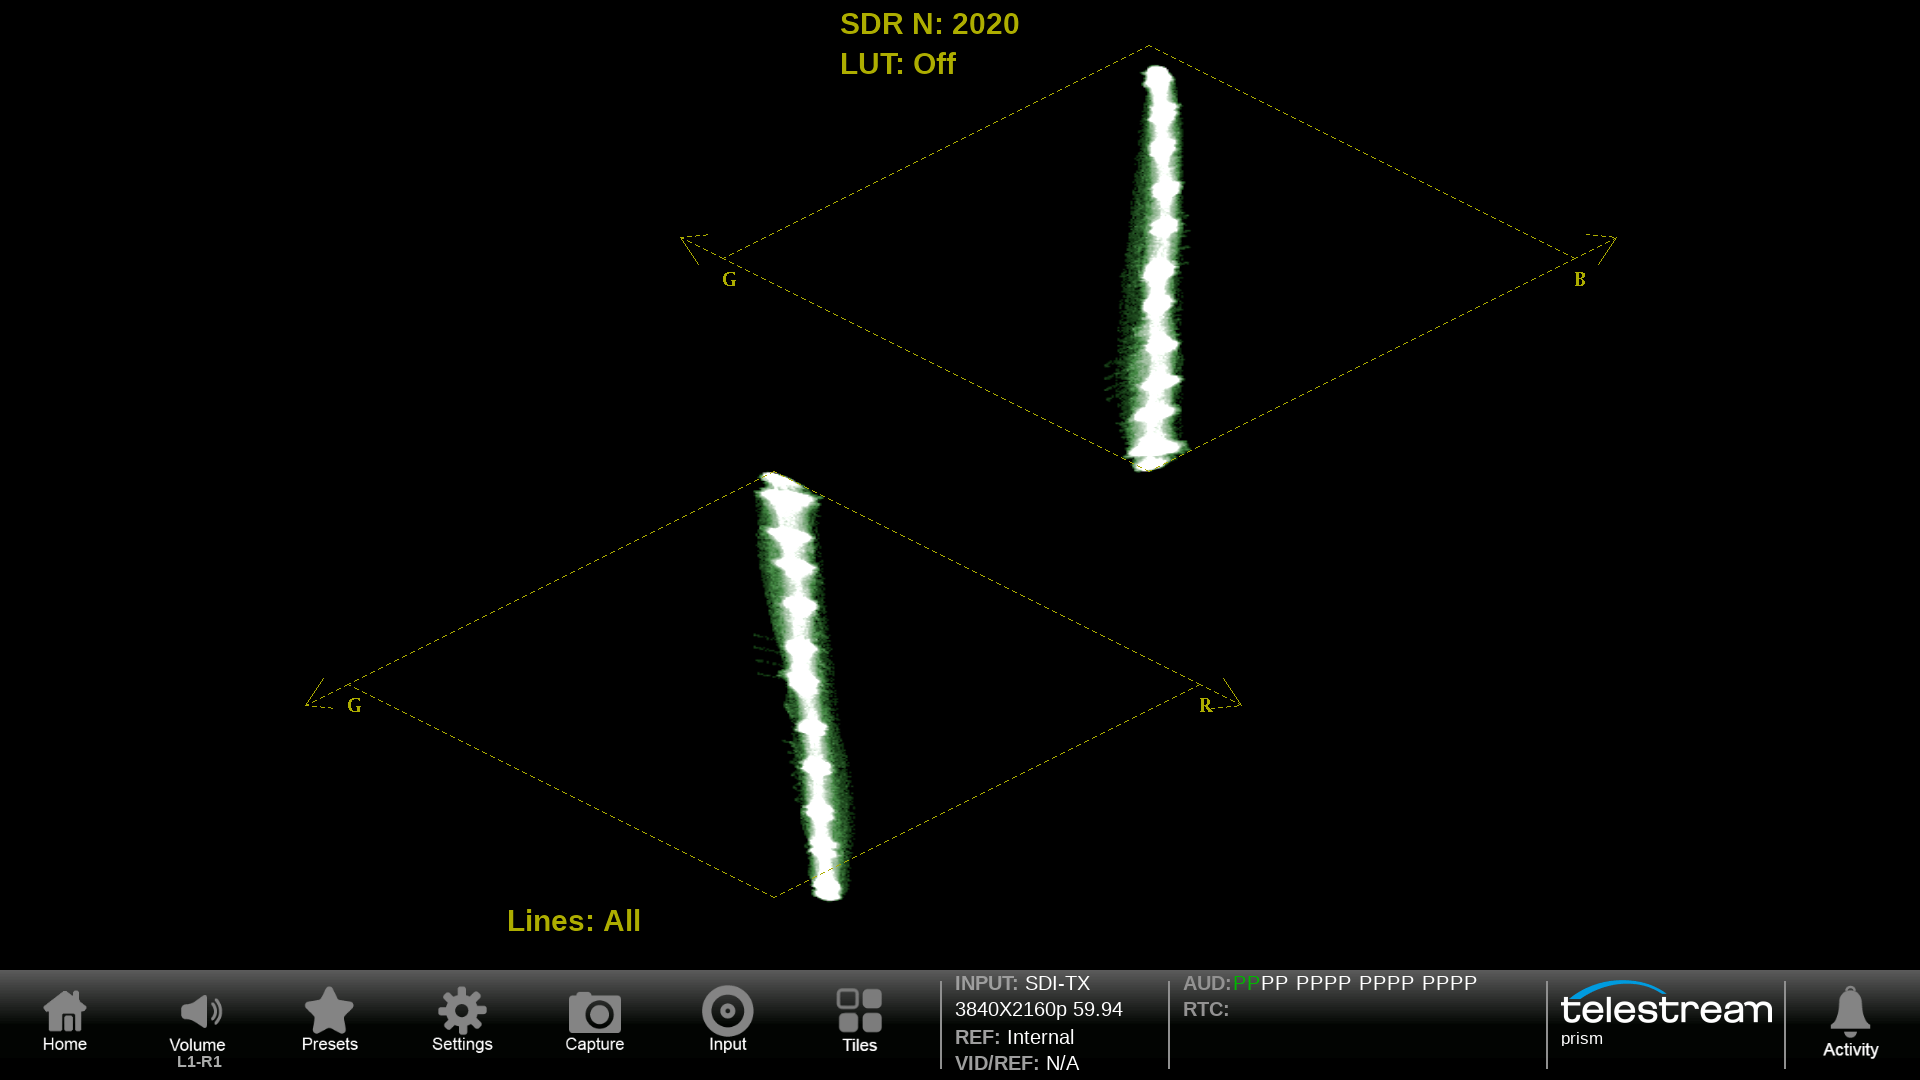
In this example a red offset has been added to the camera greyscale chart cause a deviation in the lower half of the trace.
Picture
Available software options can be used within the picture display to provide overlays for false color, HDR Area, Gamut, Lightmeter or closed caption/subtitles.
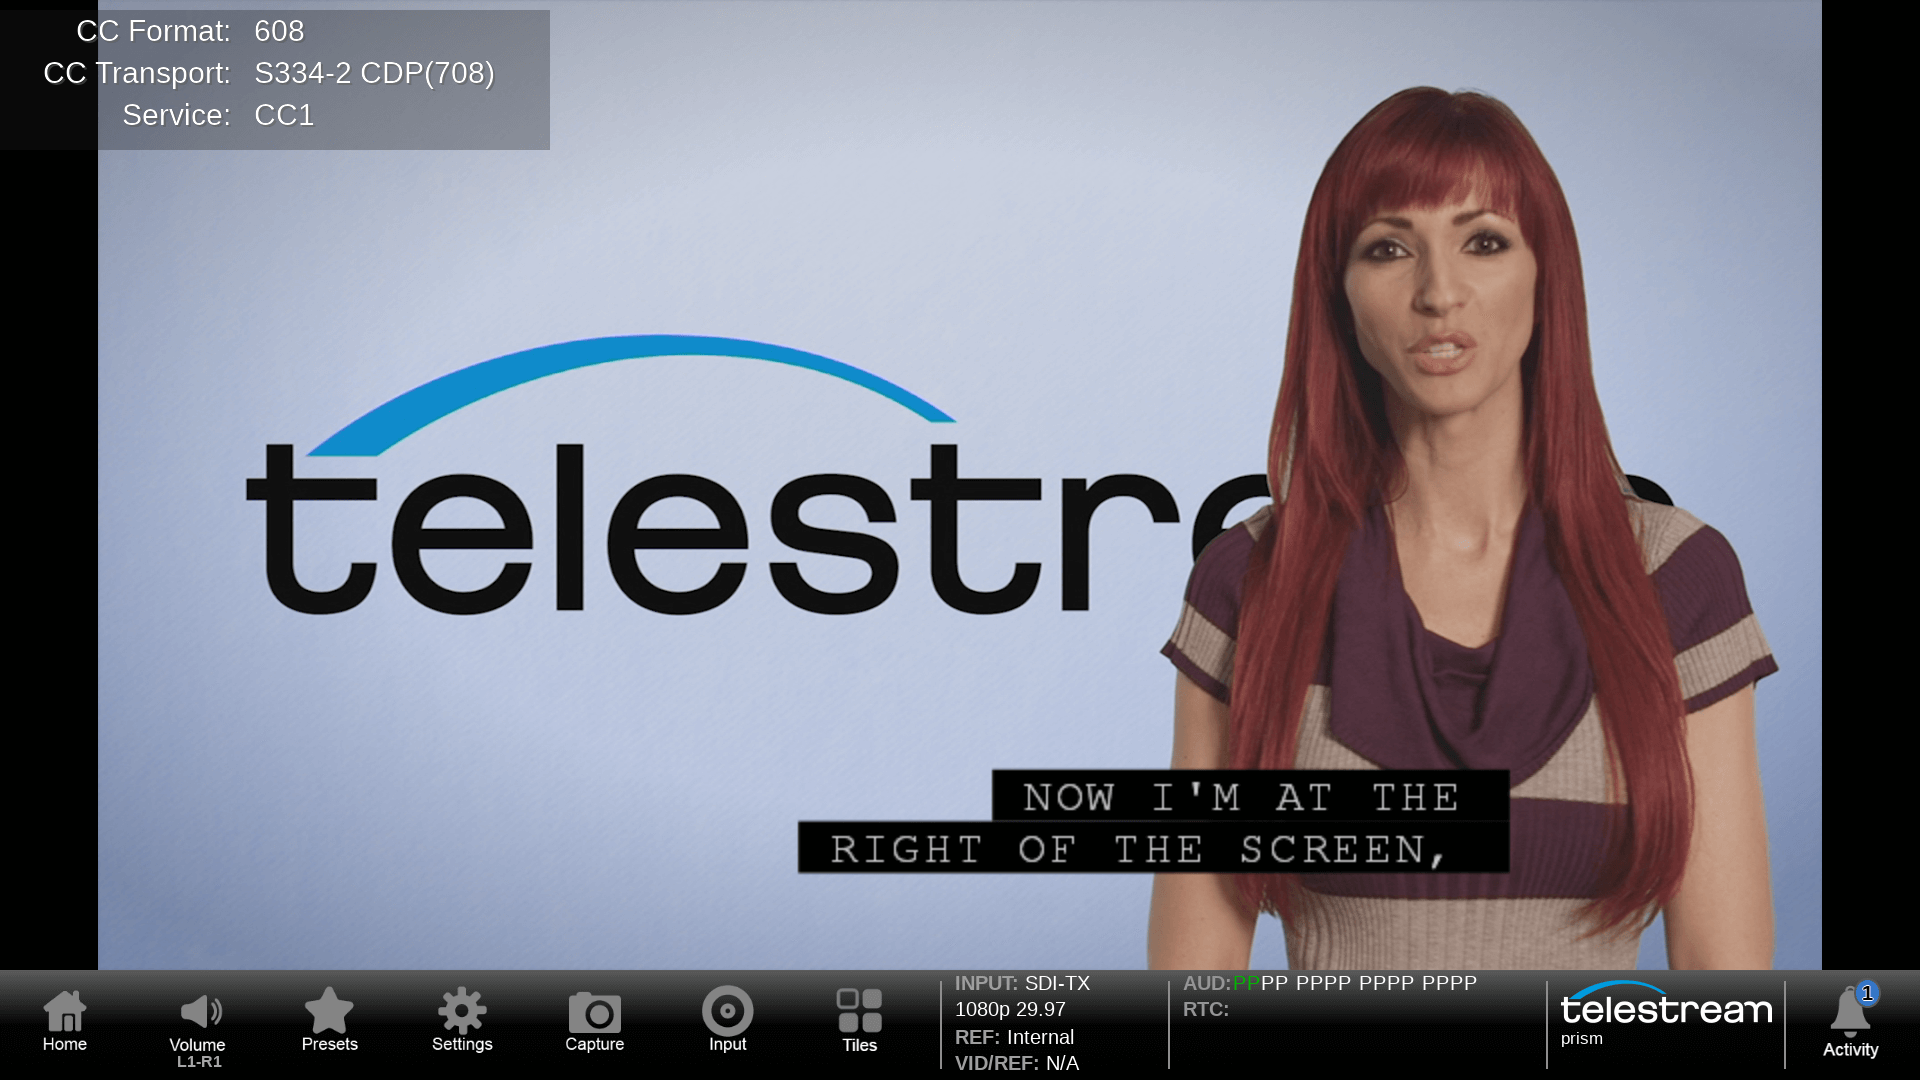
Closed Captions or subtitles can be decoded and displayed in CEA 608/708, OP47/ST2031/WST or TTML with the ENG-QC option.
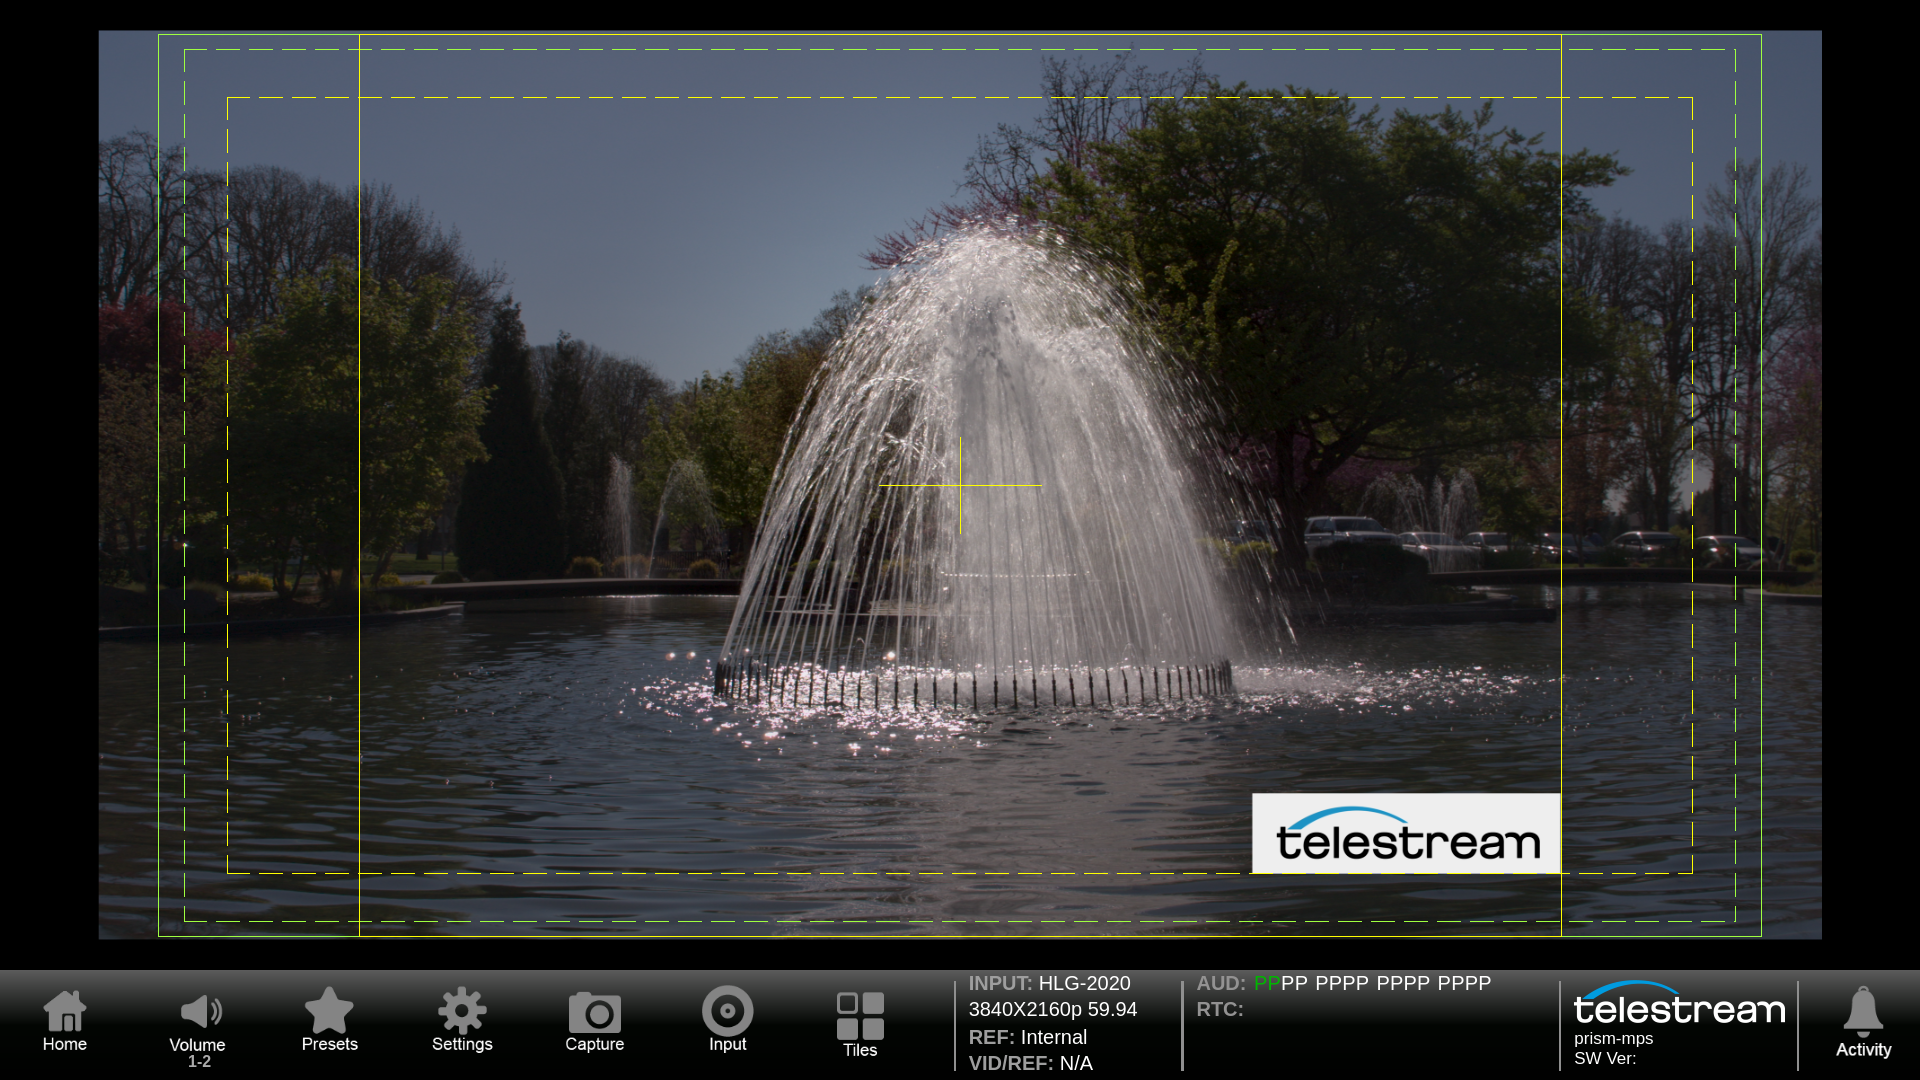
AFD information and graticule can be overlaid within the picture display. Additionally, the user can configure safe area graticules along with a center marker that can be used to help operators compose the image.
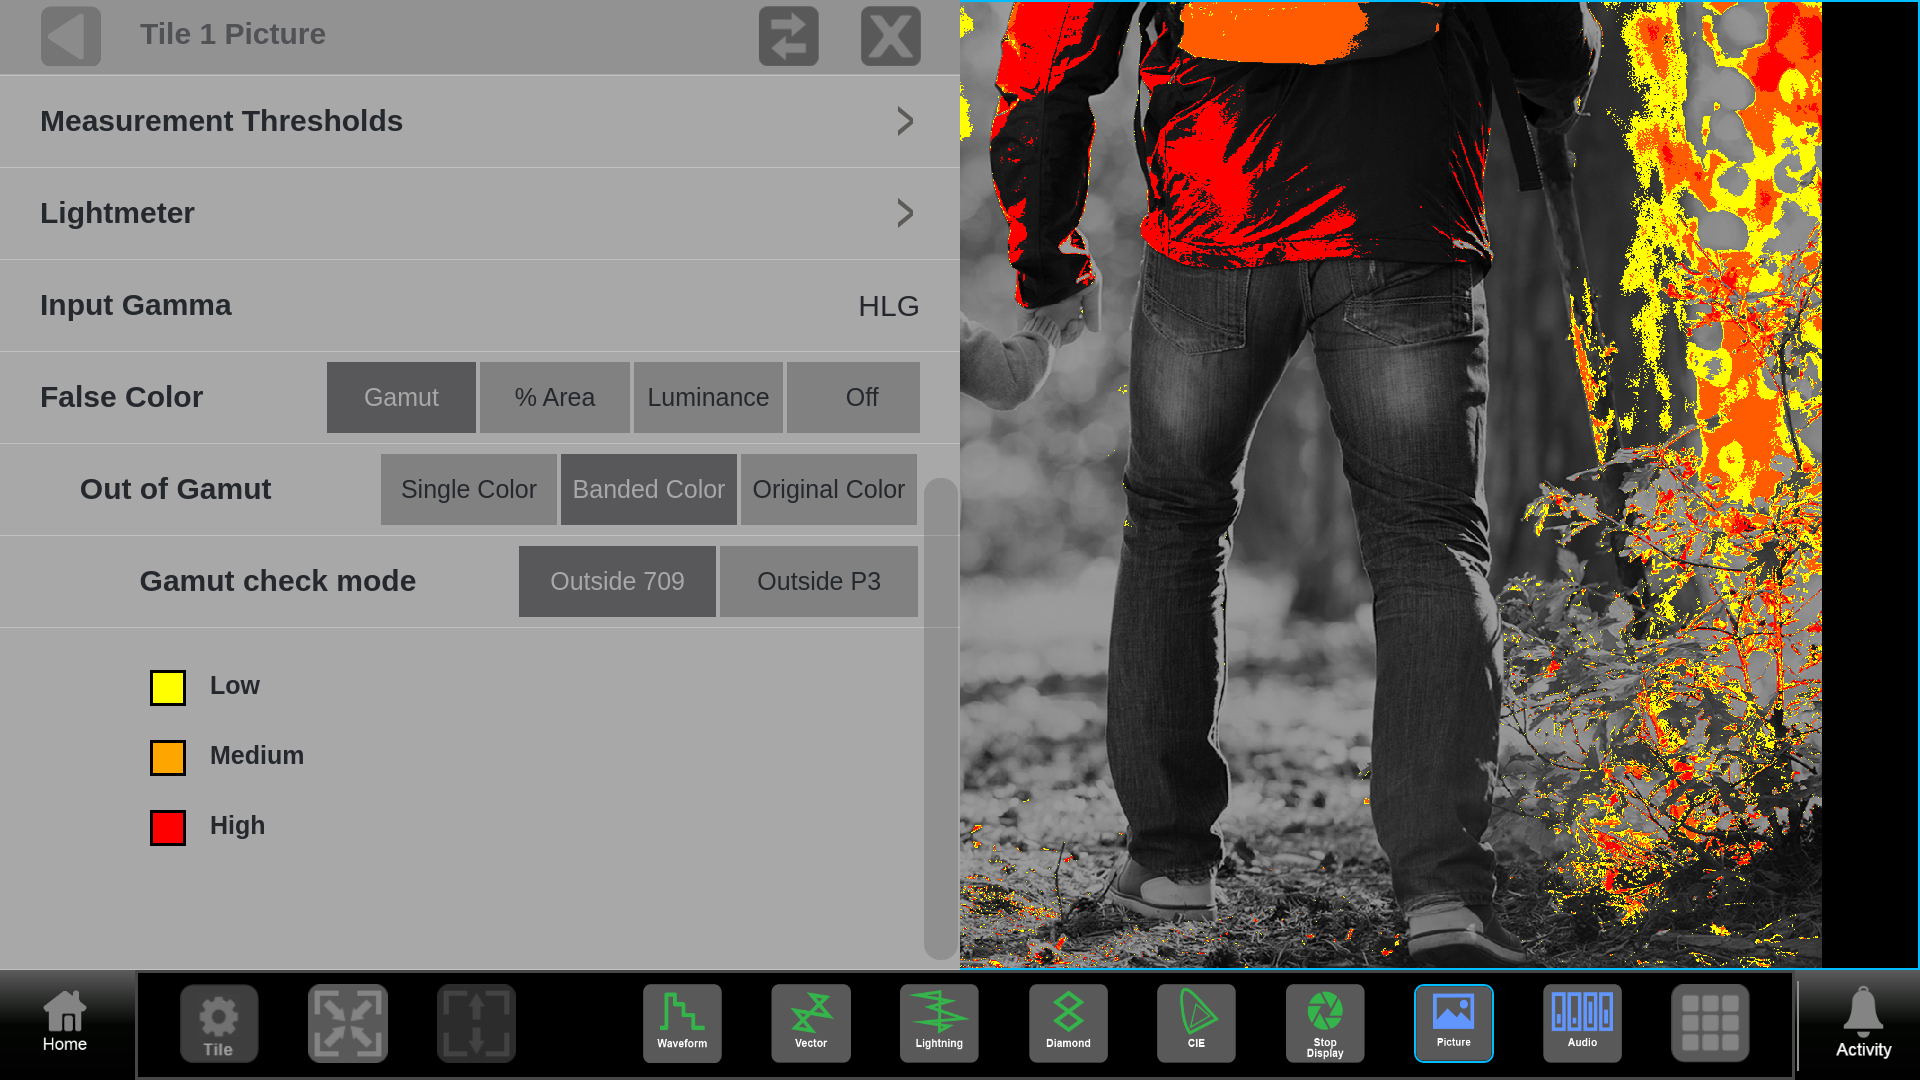
Banded False color overlay for gamut can be used to identify objects in the image that are outside of 709 or DCI-P3 with the degree of distance outside the limits of the CIE triangle indicated in yellow, orange or red color as shown.
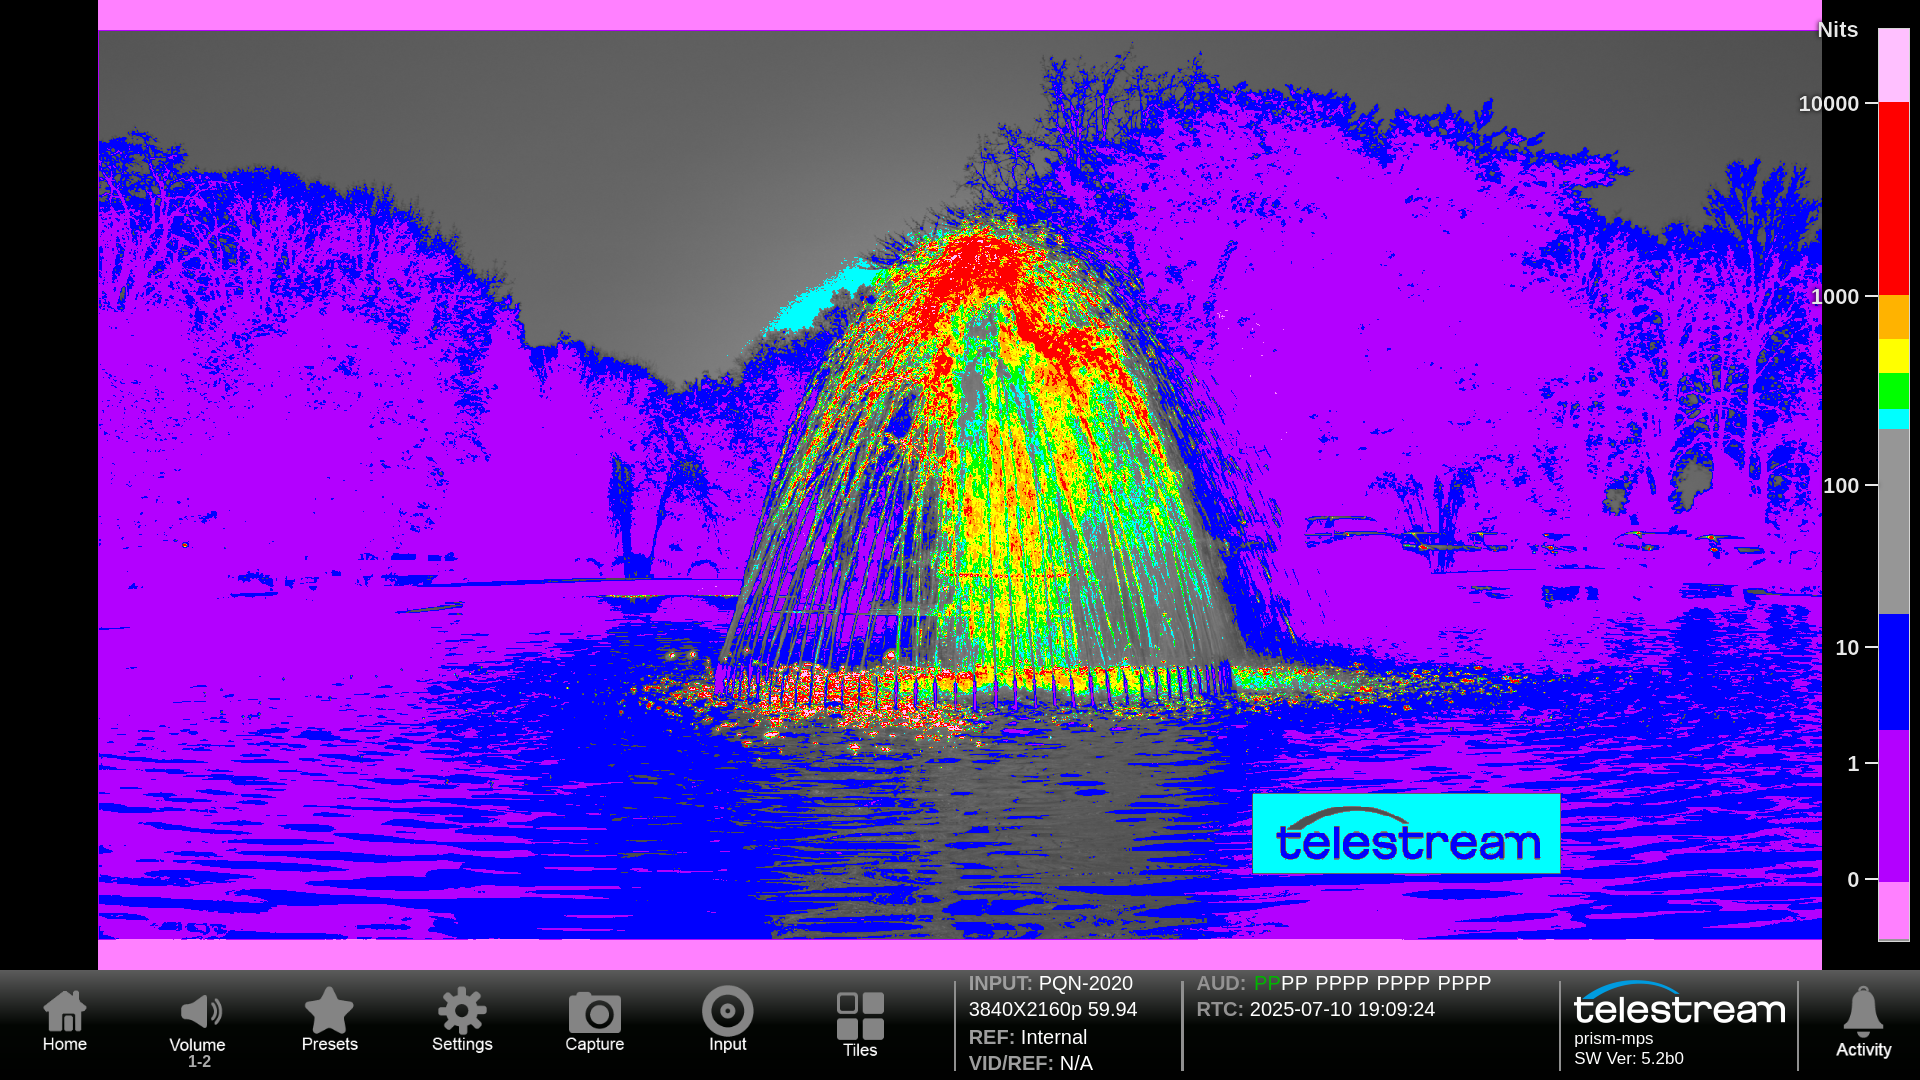
For HDR the False Color overlay can be used to identify the luma level of the signal with user defined limits for each color overlay with option PROD.
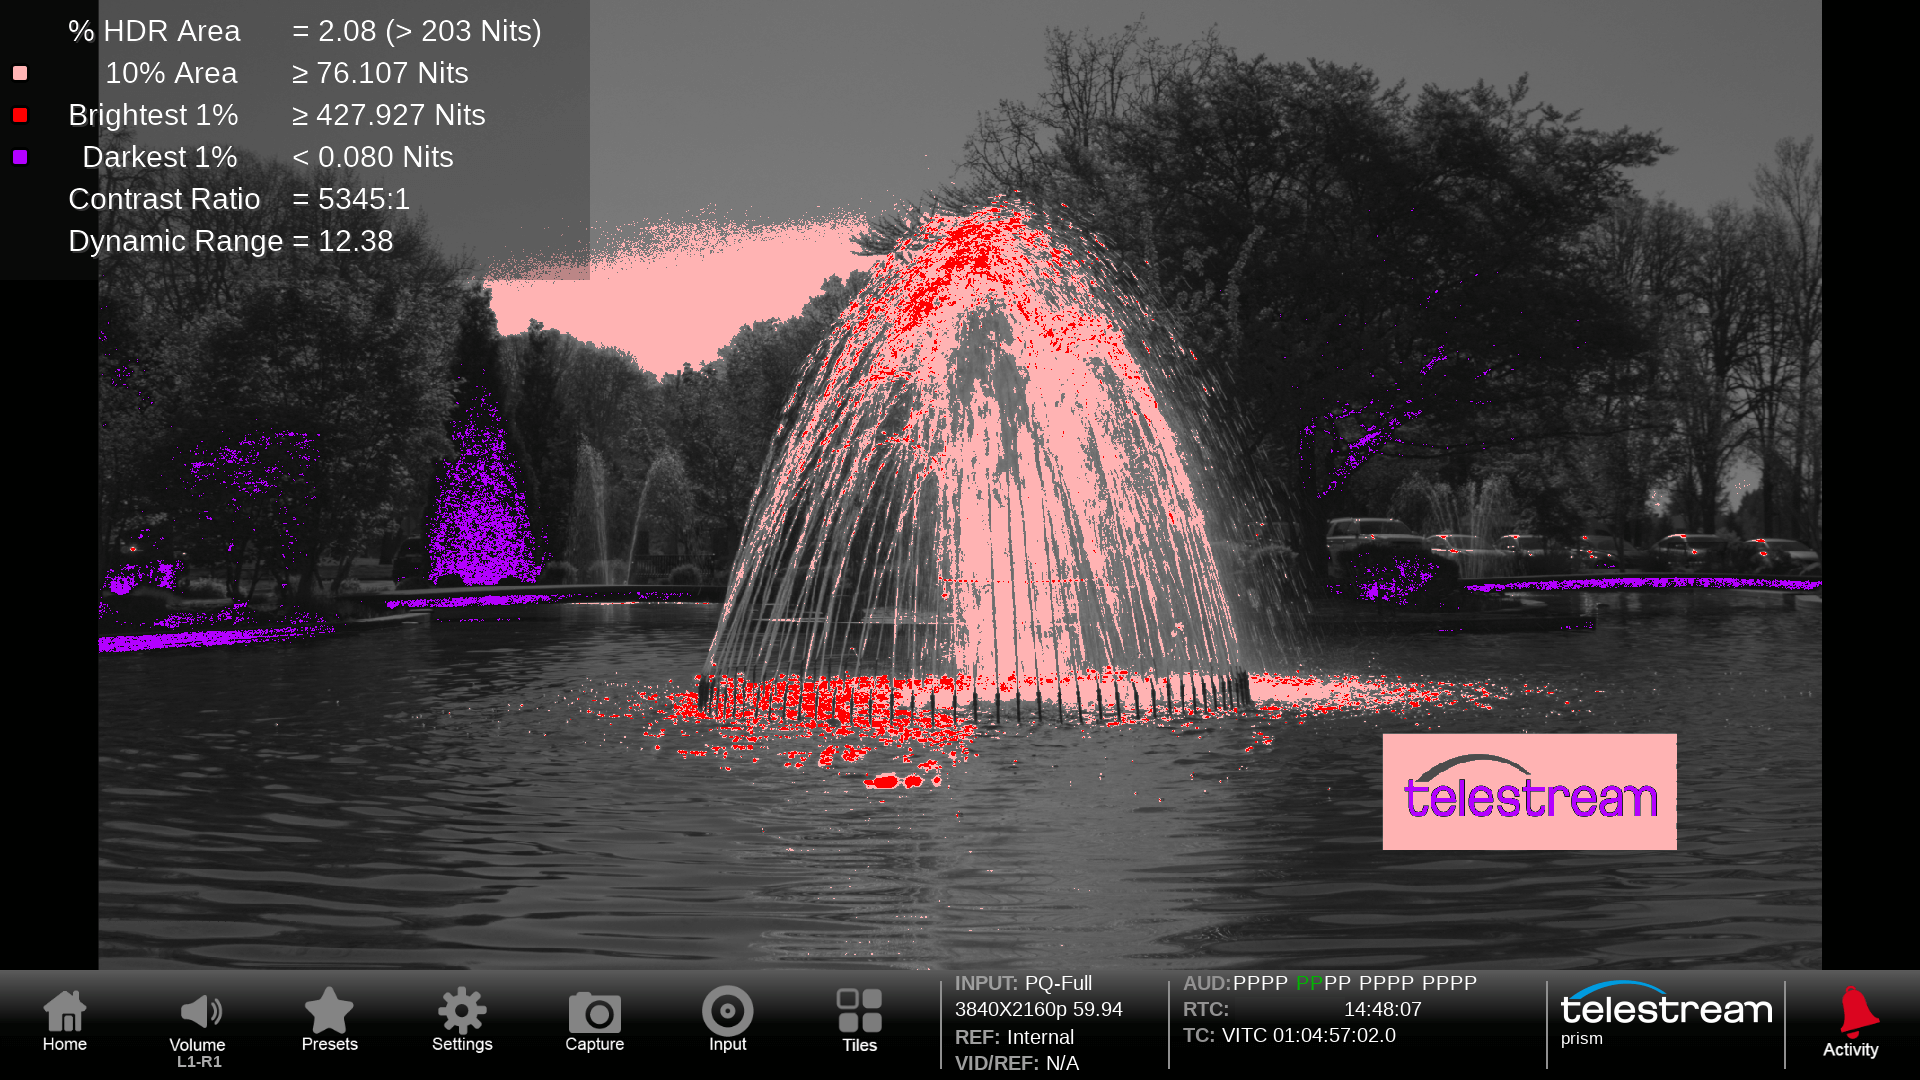
For HDR application determine the Area above the reference white threshold is critical with user thresholds and simple color overlays available in option PROD.
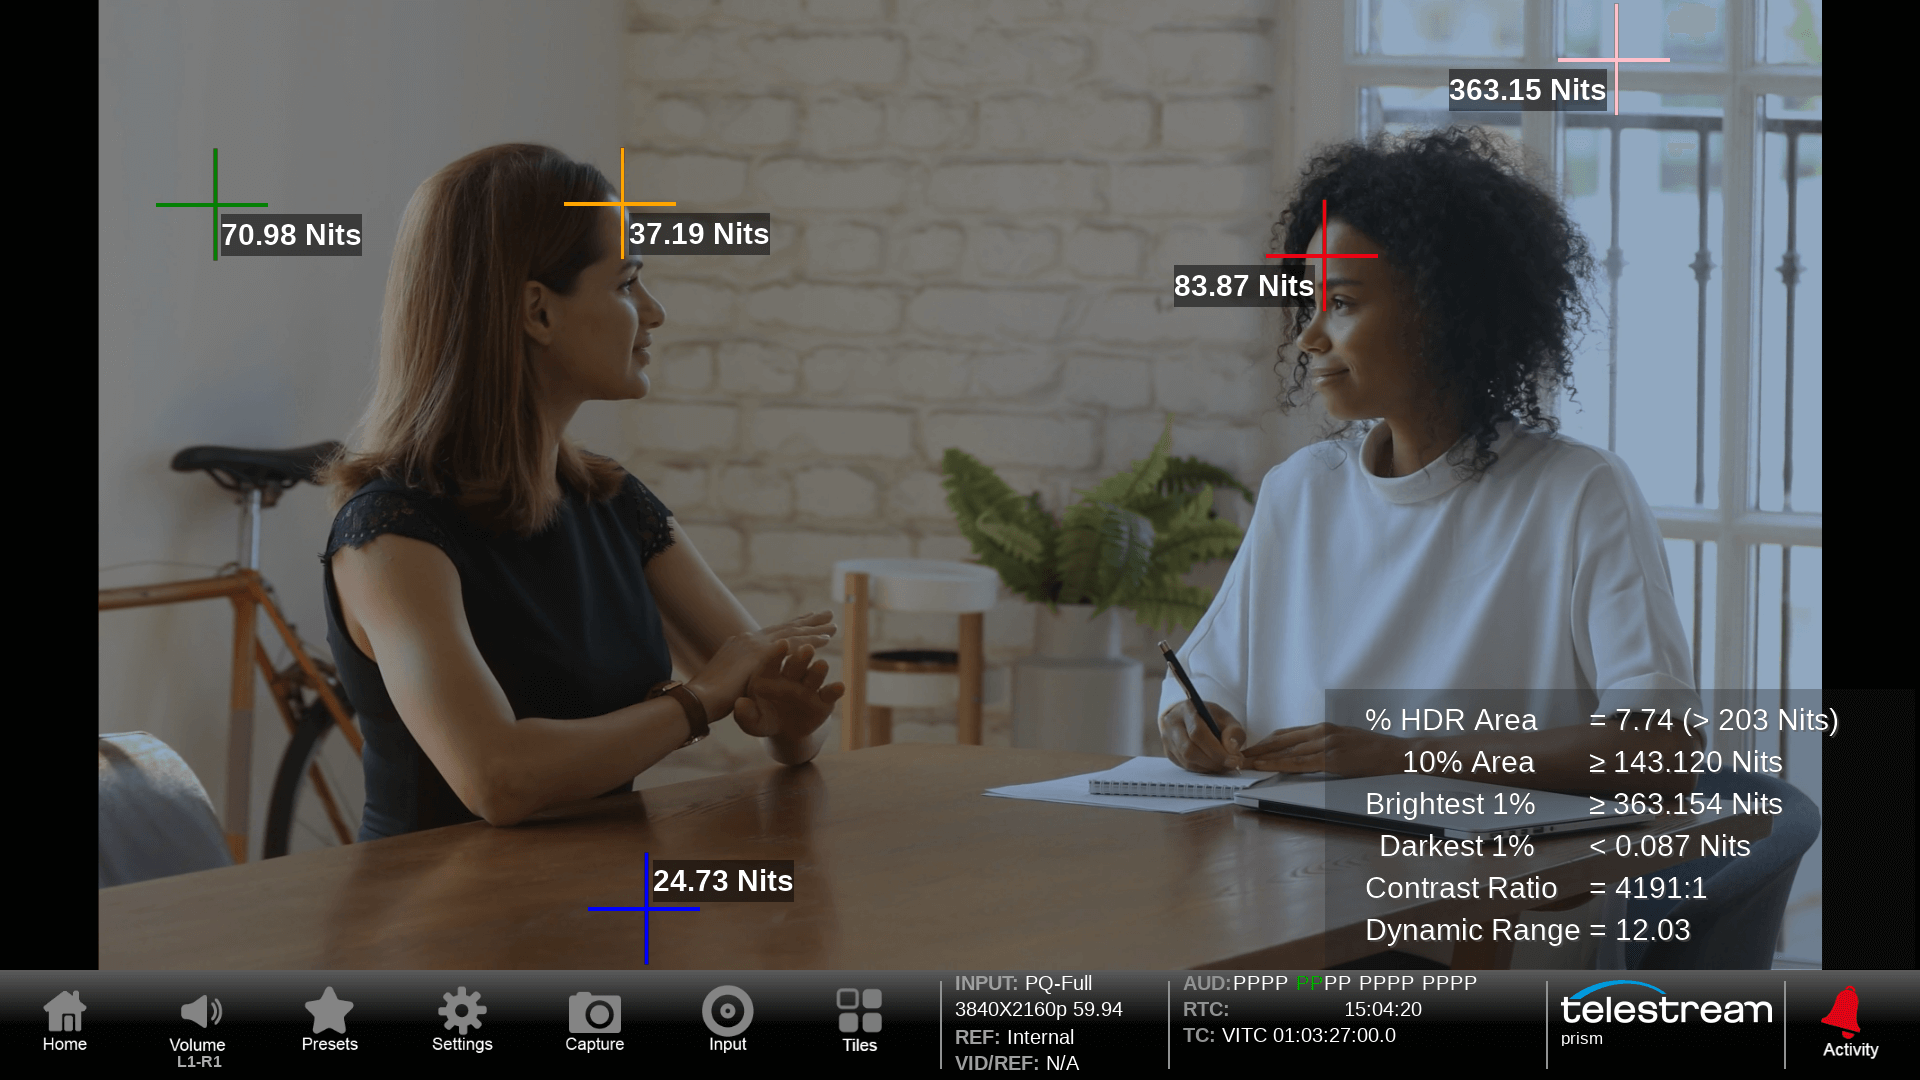
Lightmeter provides relative exposure values in Stops or Nits with up to five cursors that can be position within the image available with option PROD.
Video Session
Video Session provides format information for an SDI input the display shows SDI Format, SMPTE 352 Video Payload ID, Bit Level monitoring and CRC Status. For an IP input, the display shows Formats, SMPTE 352 Video Payload ID, Bit Level monitoring and JPEG XS metadata. SDI Vu provides continuous updates of each SDI input status.
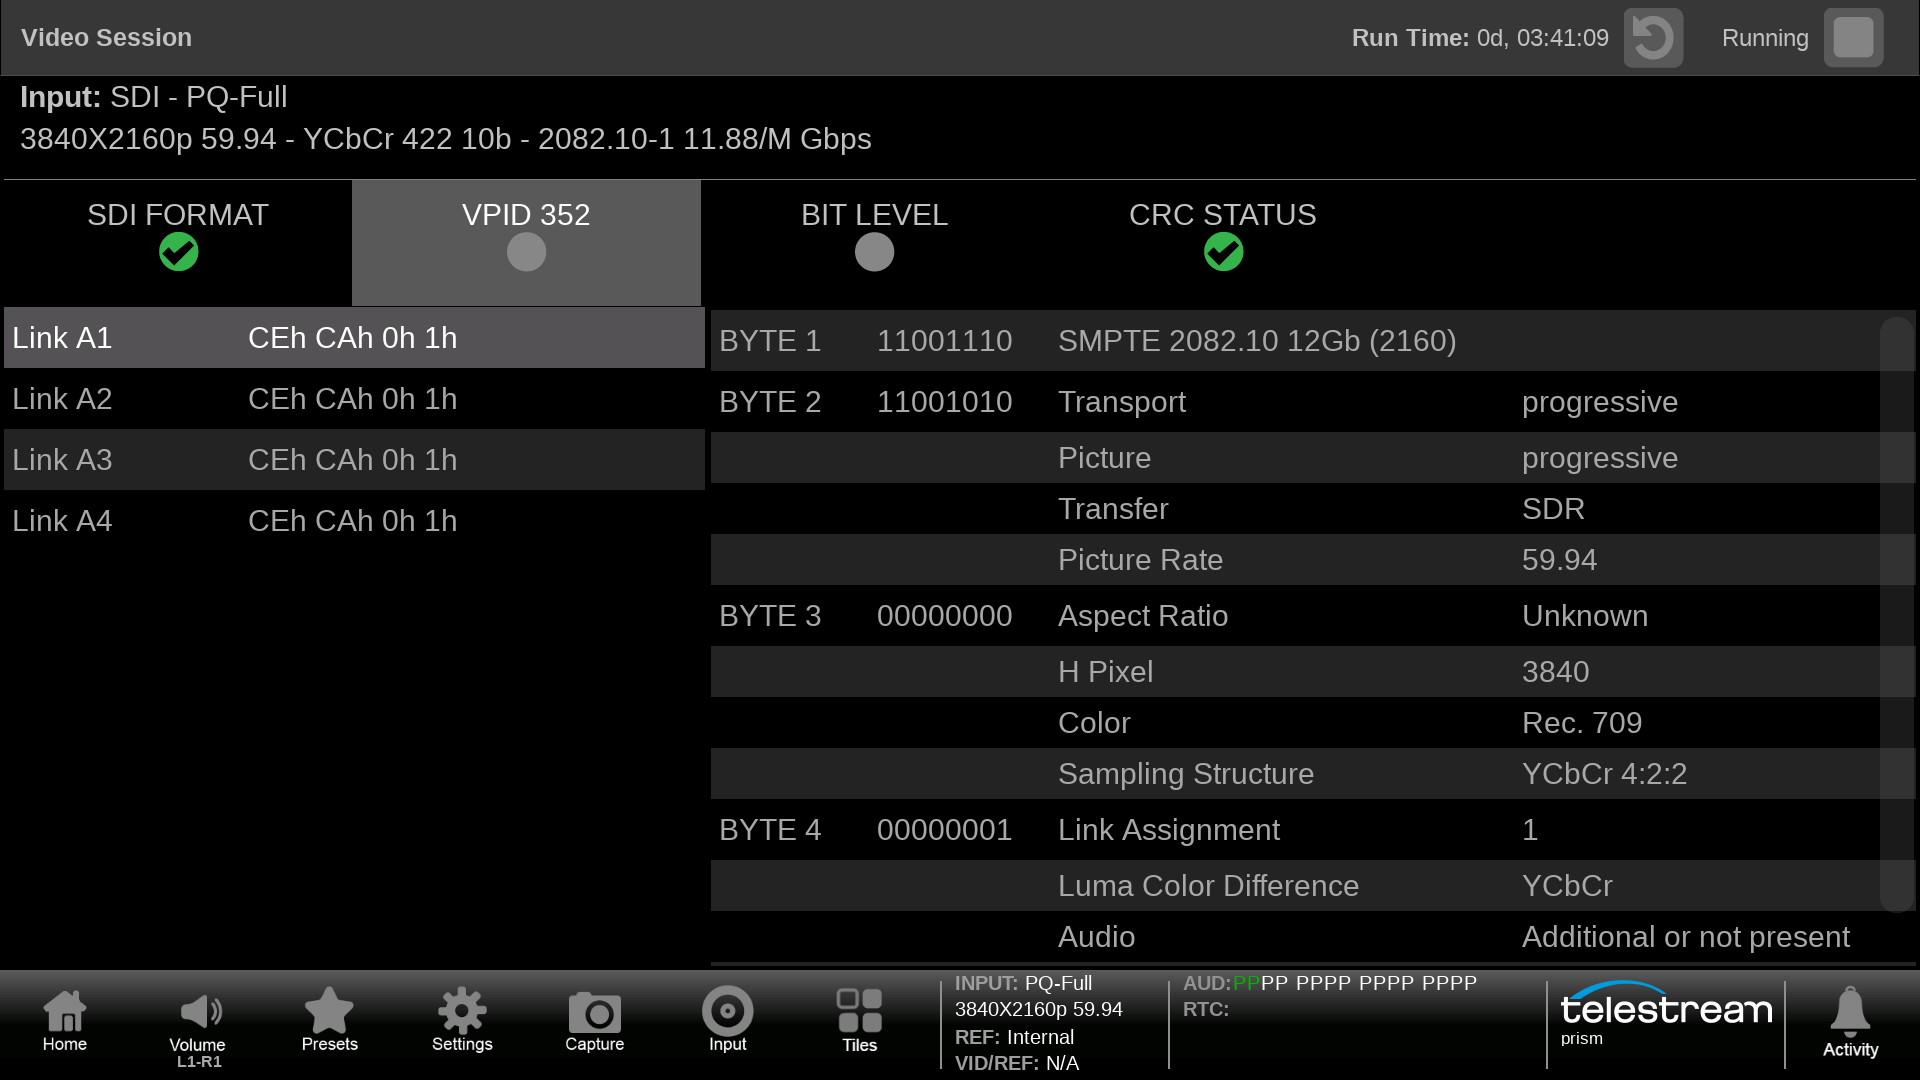
VPID 352 page provides interpretation of the format of the signal such as transport, picture rate, aspect ratio, color, sampling structure and bit depth.
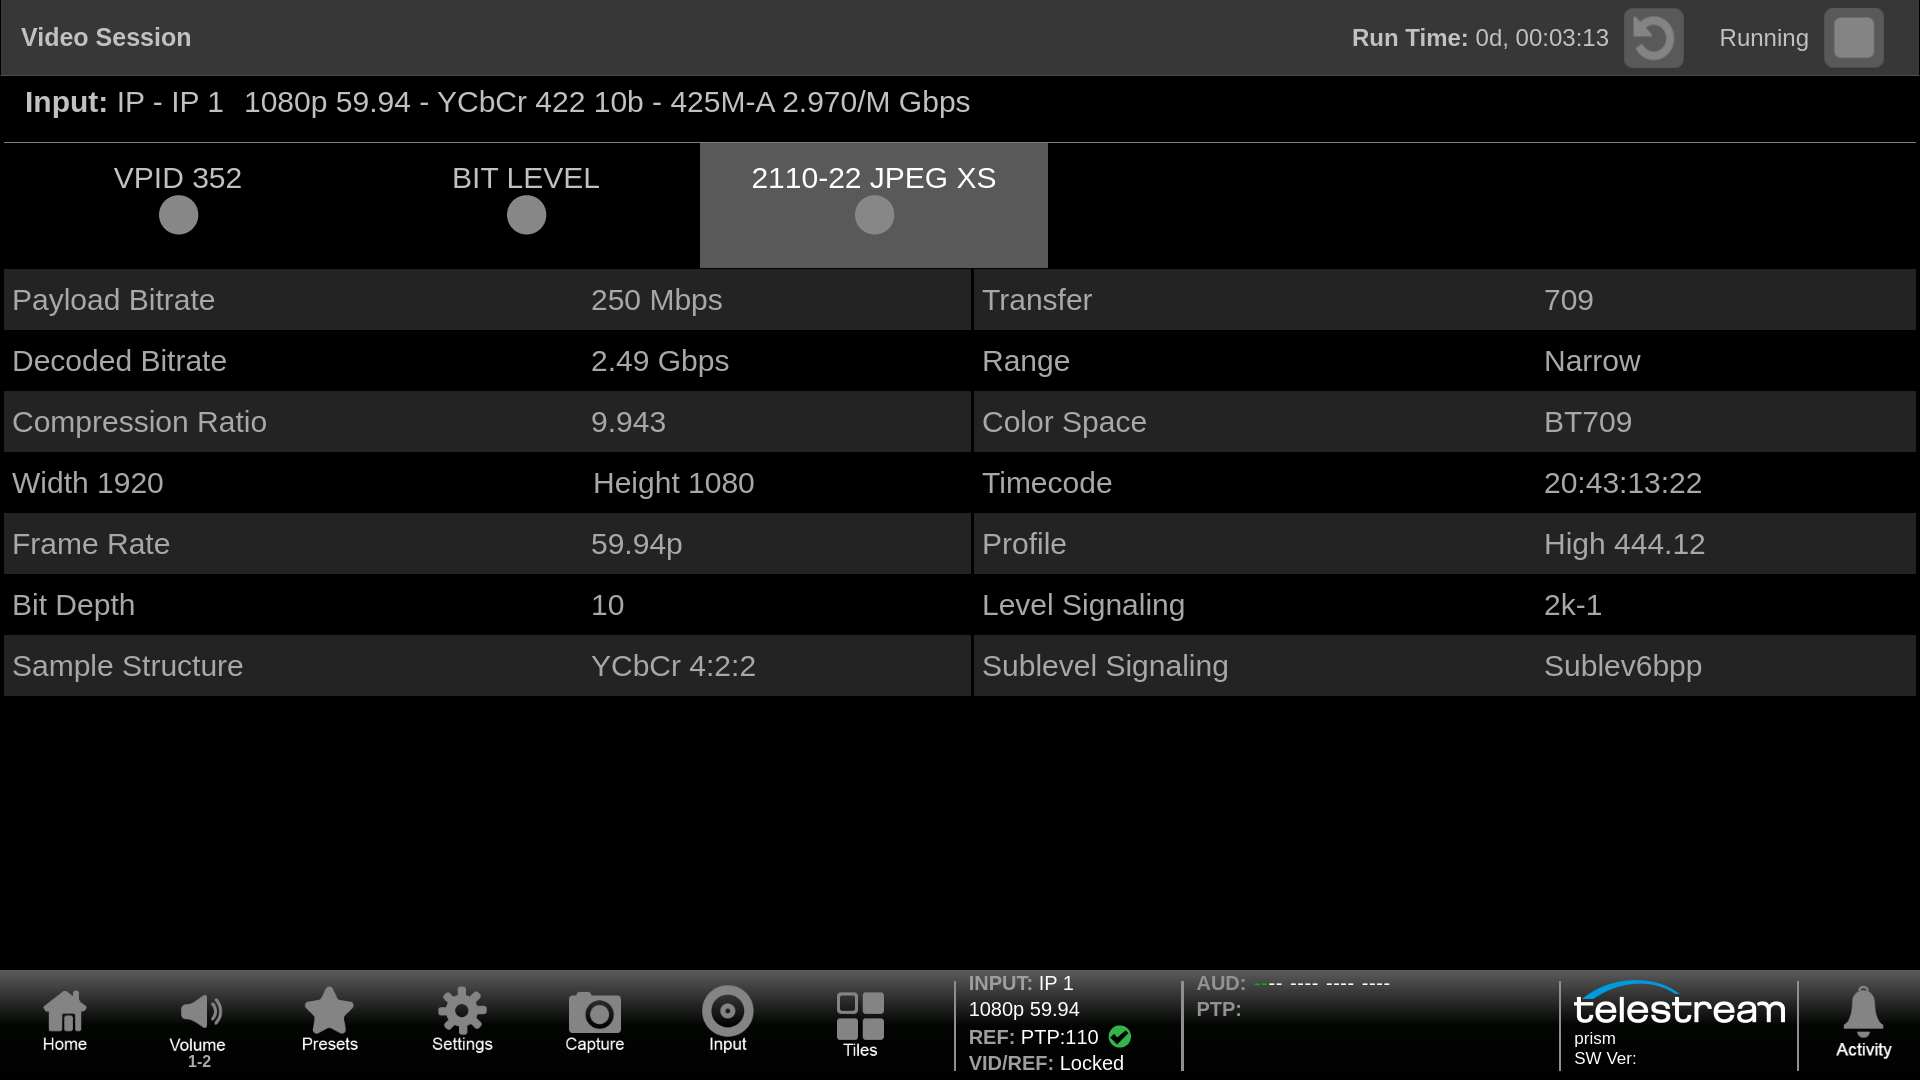
JPEG XS metadata information can be decoded and displayed when receiving a ST2110-22 stream. This can be useful in checking stream syntax and diagnose possible interoperability issues.
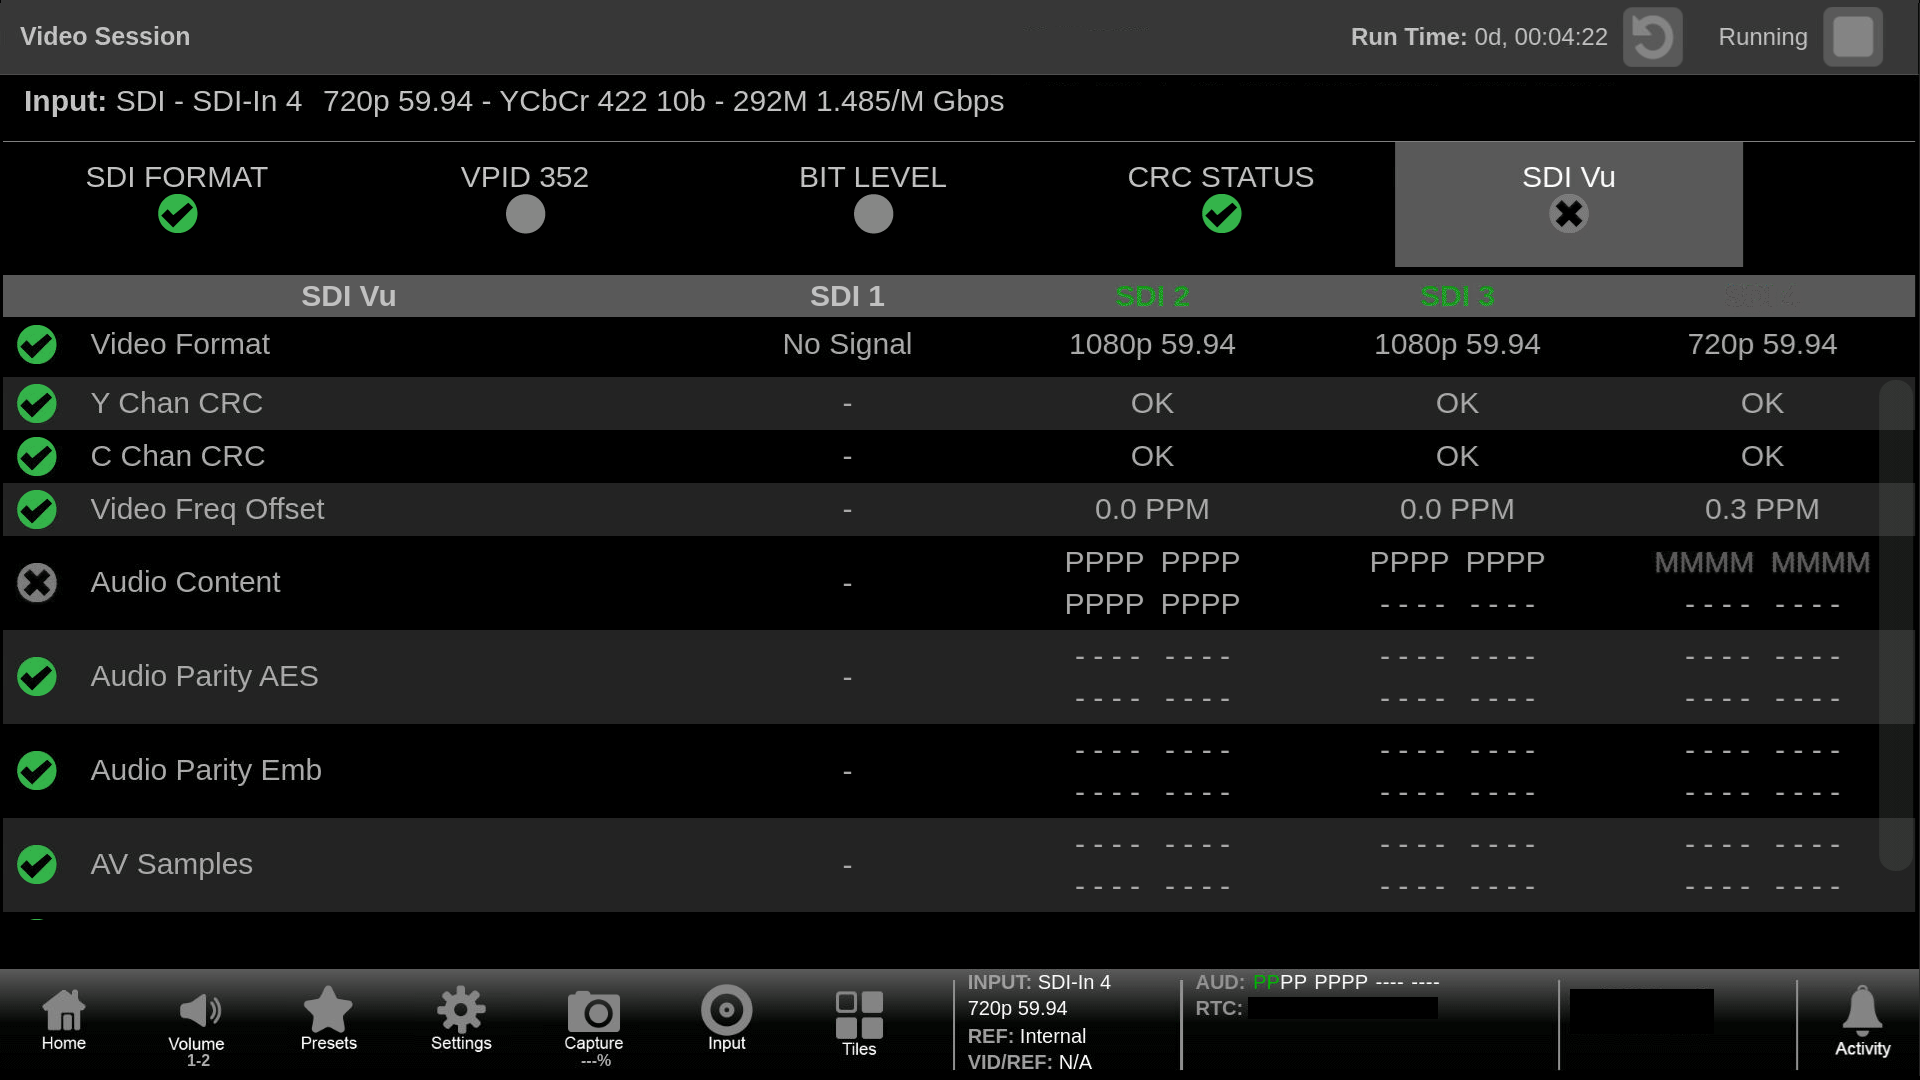
SDI Vu monitors the four SDI inputs continually regardless of the selected input. The errors and events detected can be viewed in SDI Vu TAB, Dashboard, and logged in Event log application or monitored using SNMP/API. This can be useful in contribution / distribution link monitoring applications for broadcasters using SDI / IP hybrid environment.
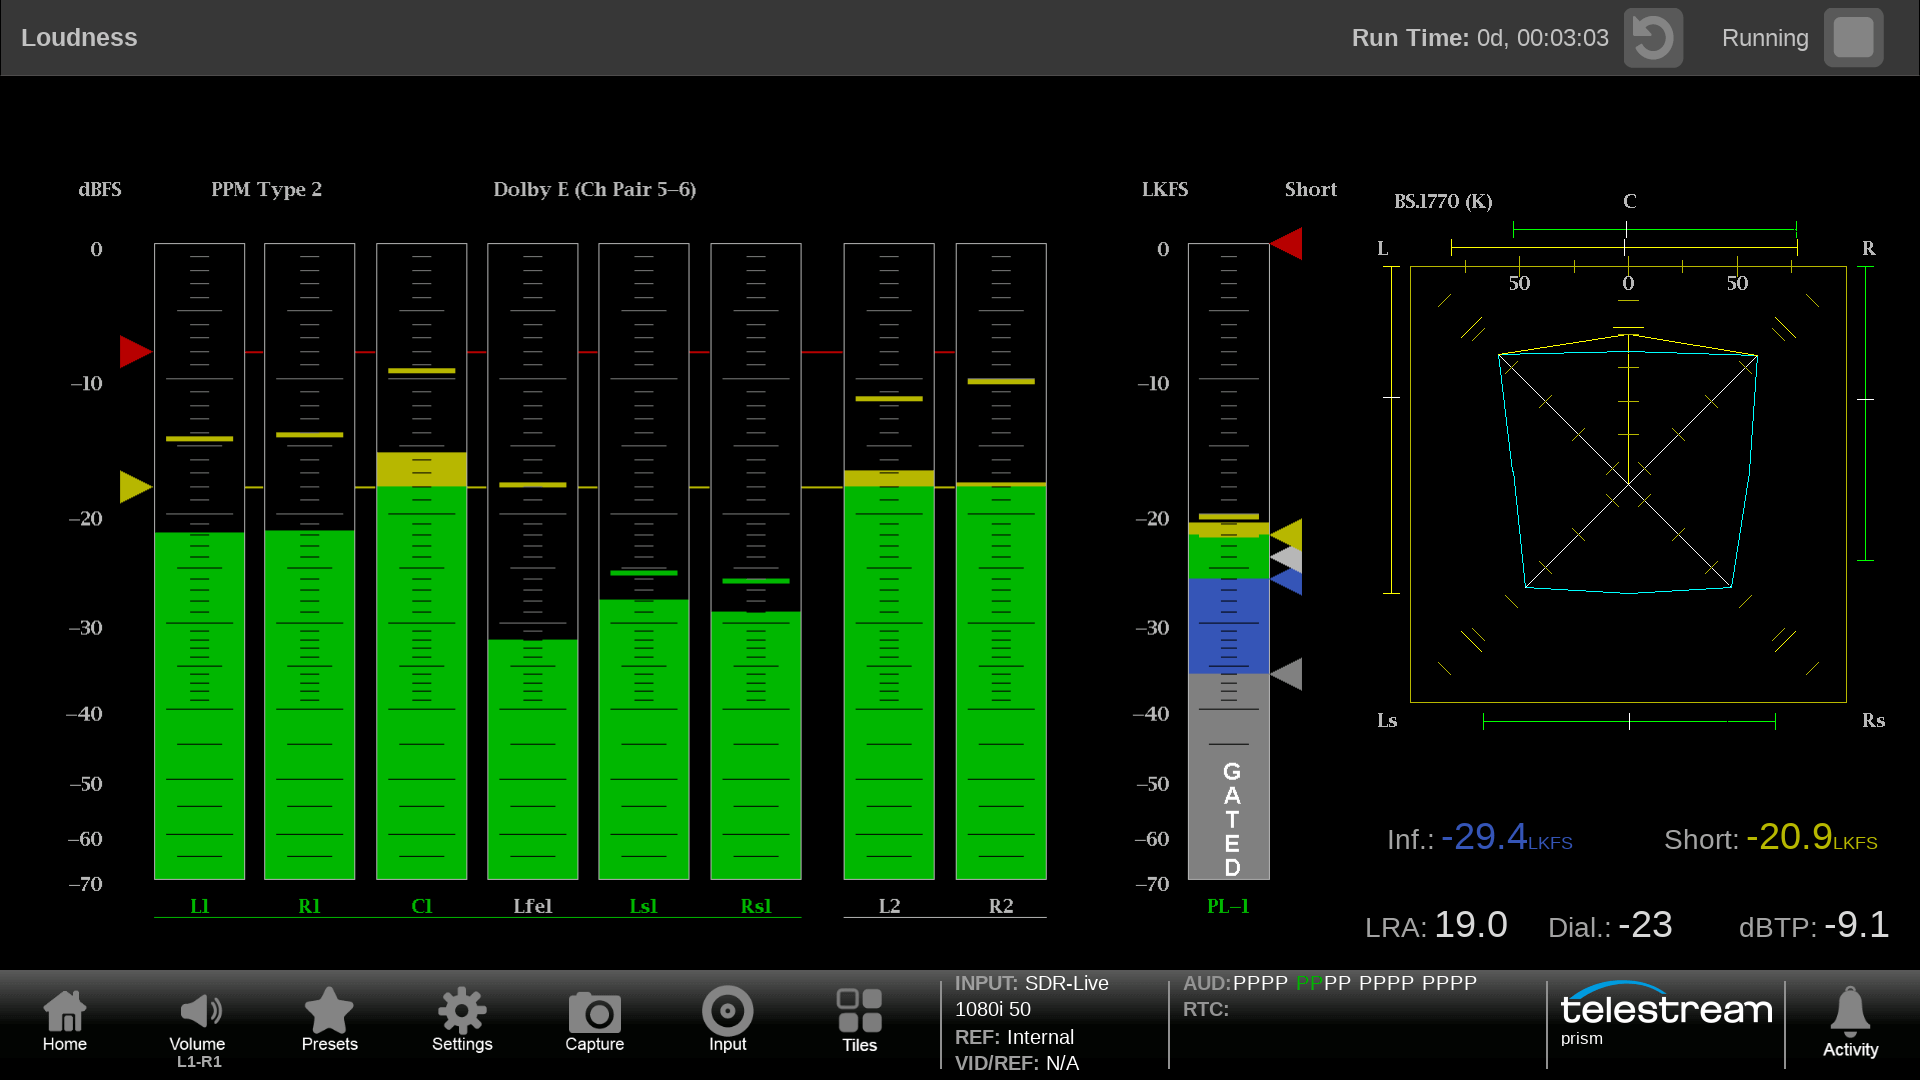
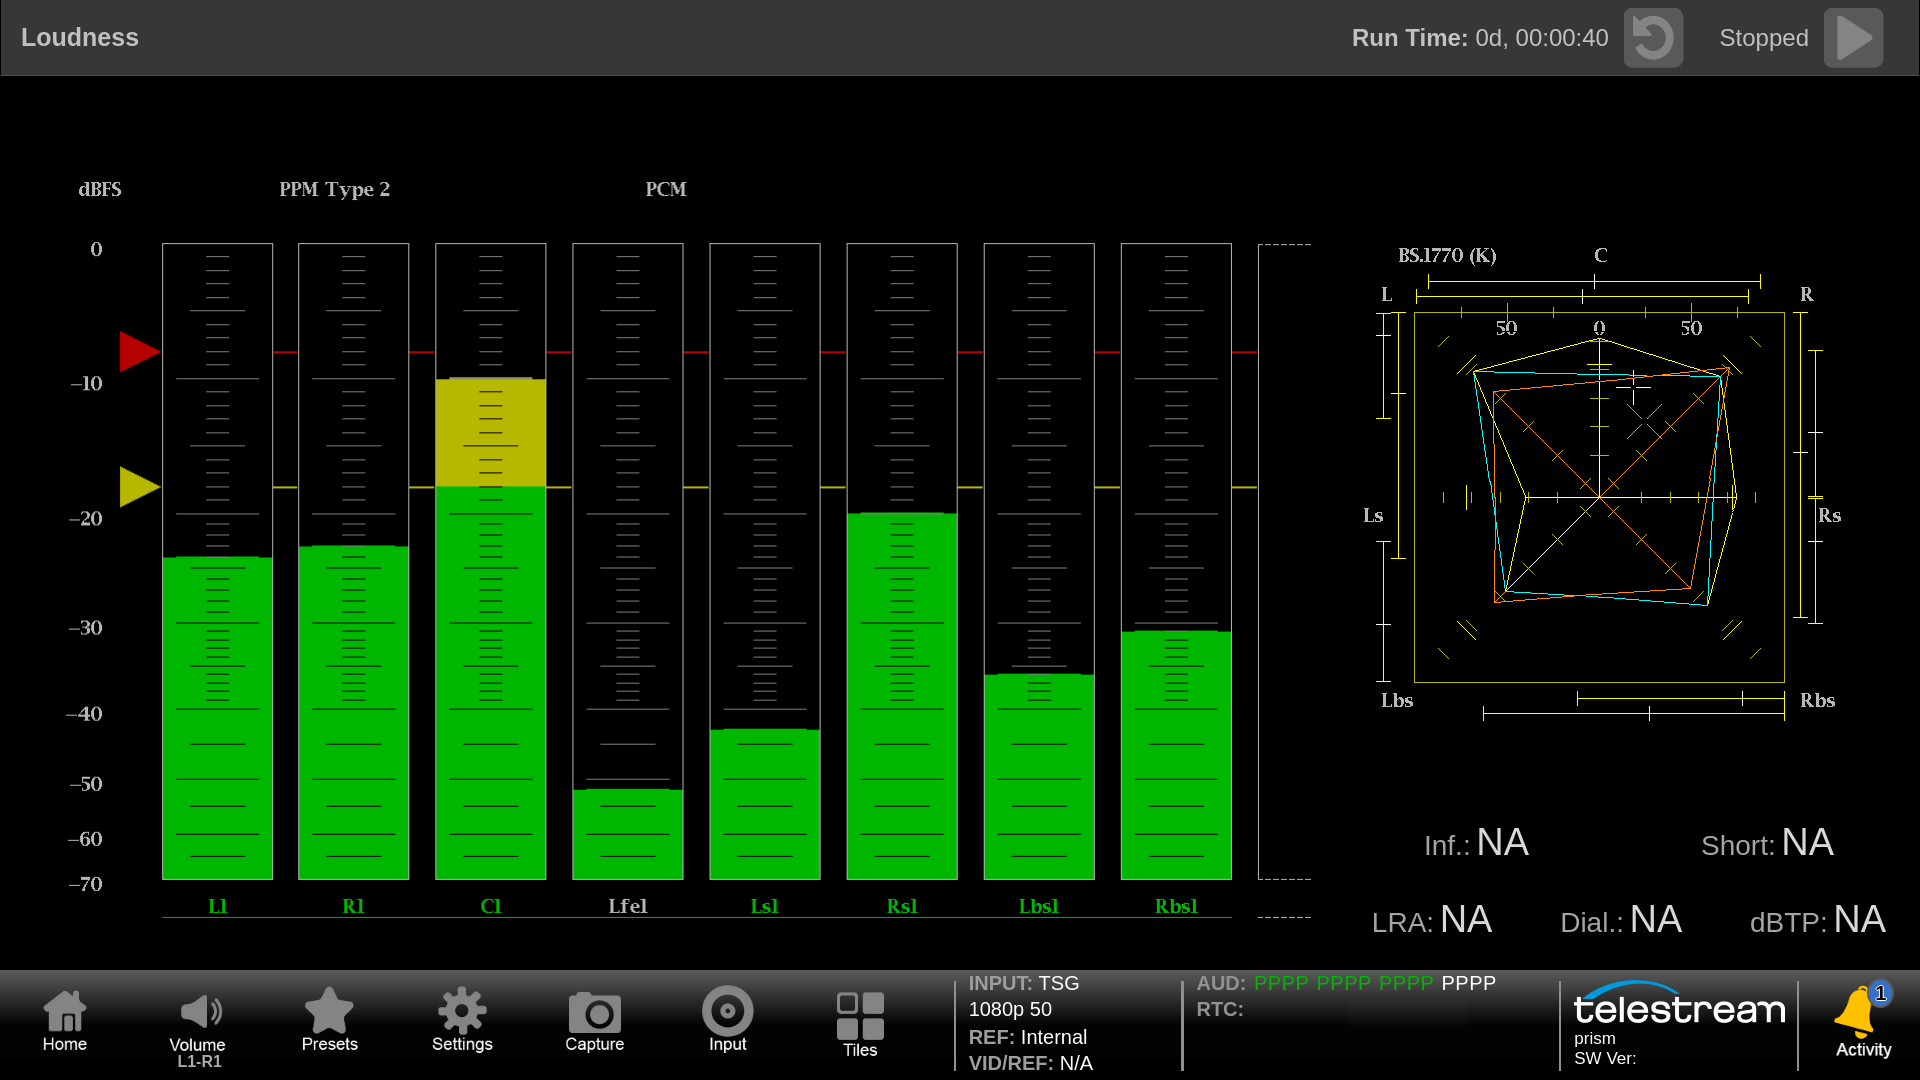
Audio Display
The Audio Display provides an array of tools to monitor audio levels, audio session with Lissajous, Loudness and RTW Surround displays. Audio bars are part of the standard applications. Requires option AUD to enable Phase display, Session and Loudness measurements, and requires option SRND to enable surround display.
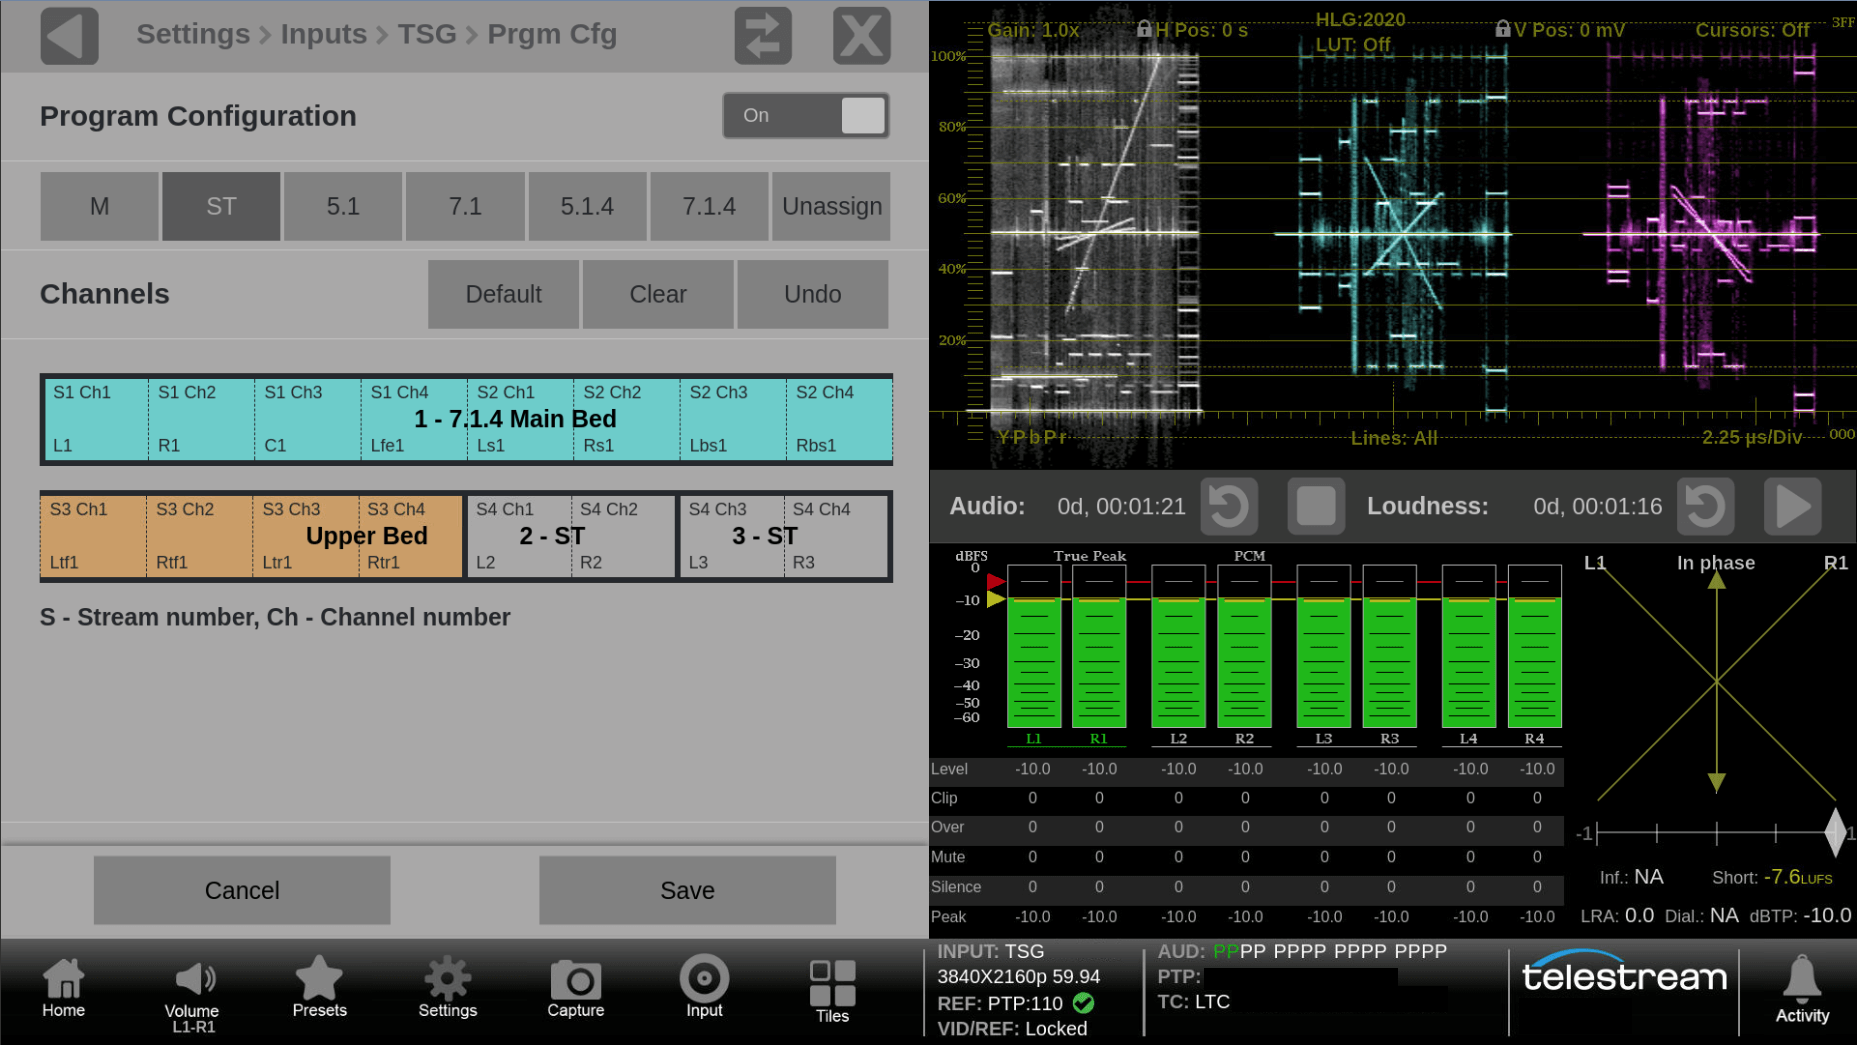
The audio display can be configured for a variety of audio programs, Mono, Stereo, 5.1, 7.1, 5.1.4 and 7.1.4 (up to 32 channels for 4K/8K format and 16 channels for IP and other SDI formats).
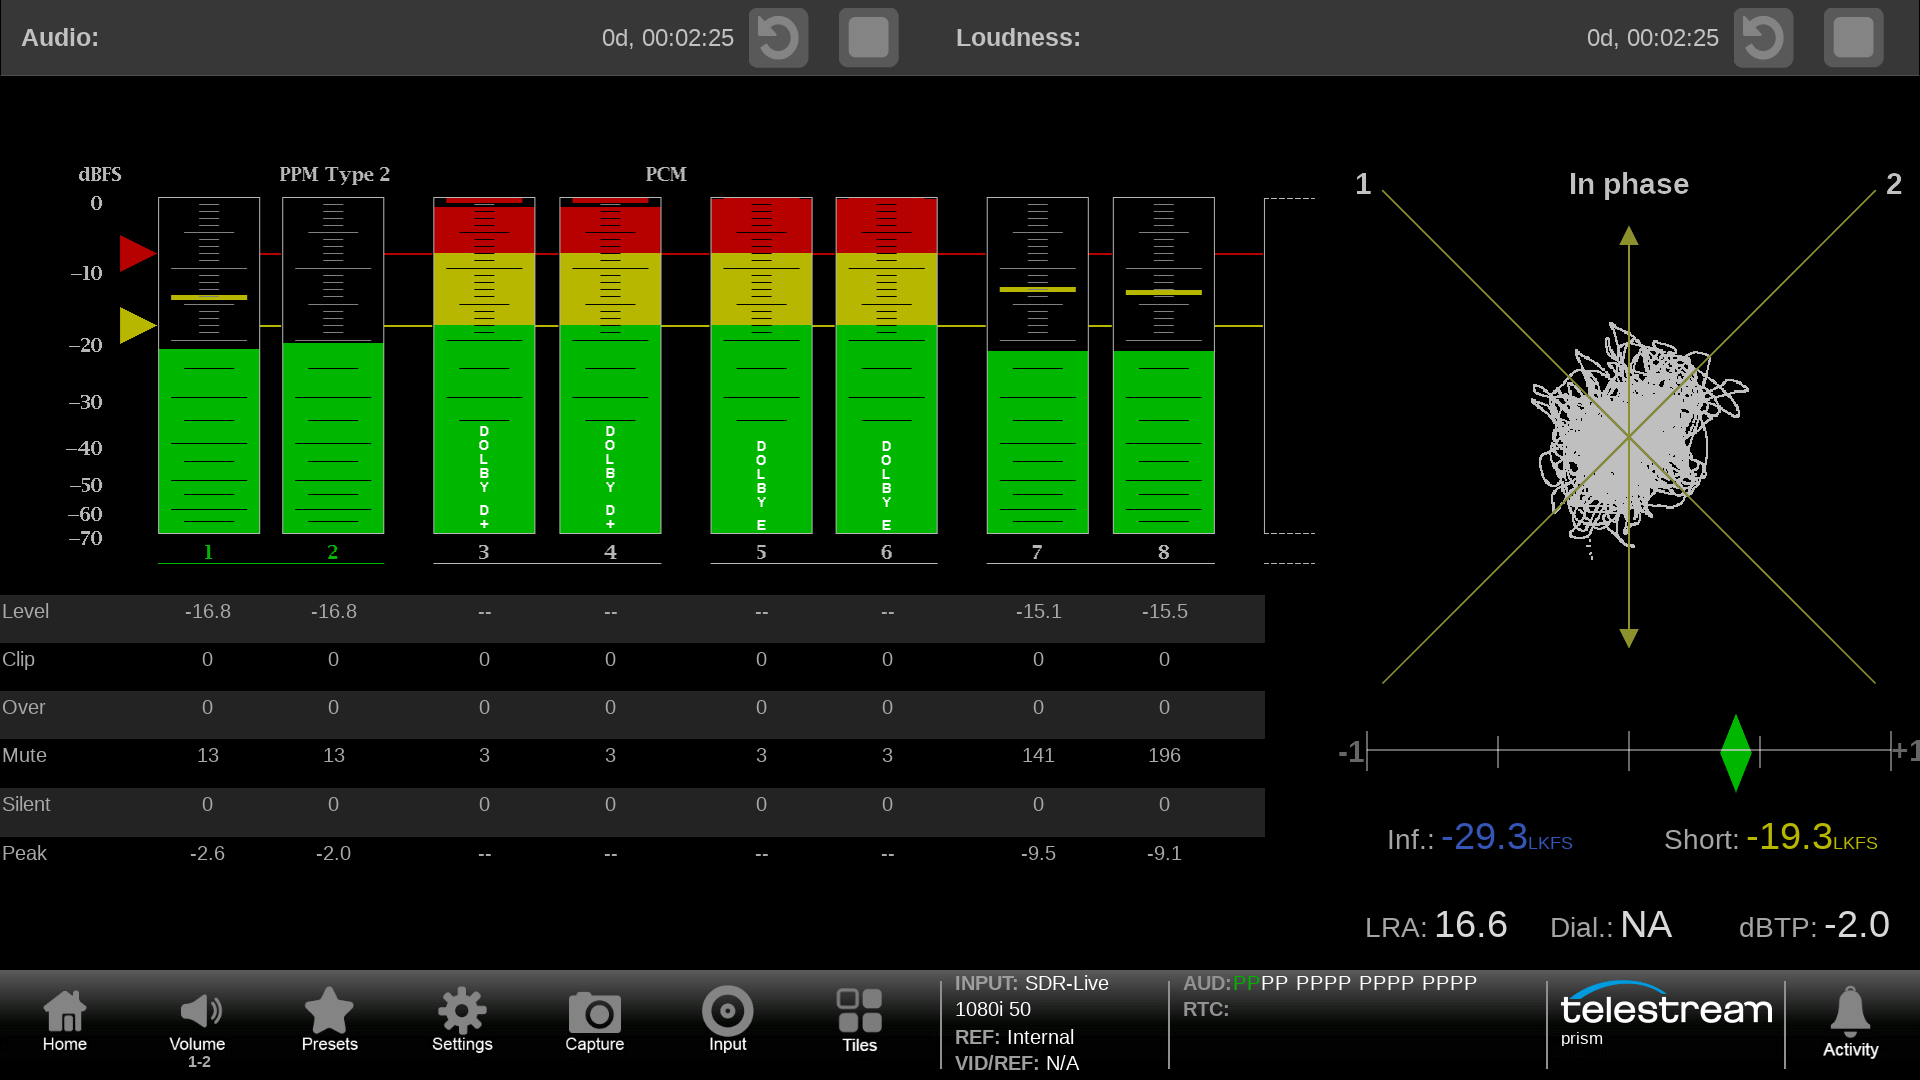
A selected audio program can be monitored with headphone with down mix / solo mode. The audio session display provides information on a variety of parameters for audio level, clips, mute, silence and peaks with event logging.
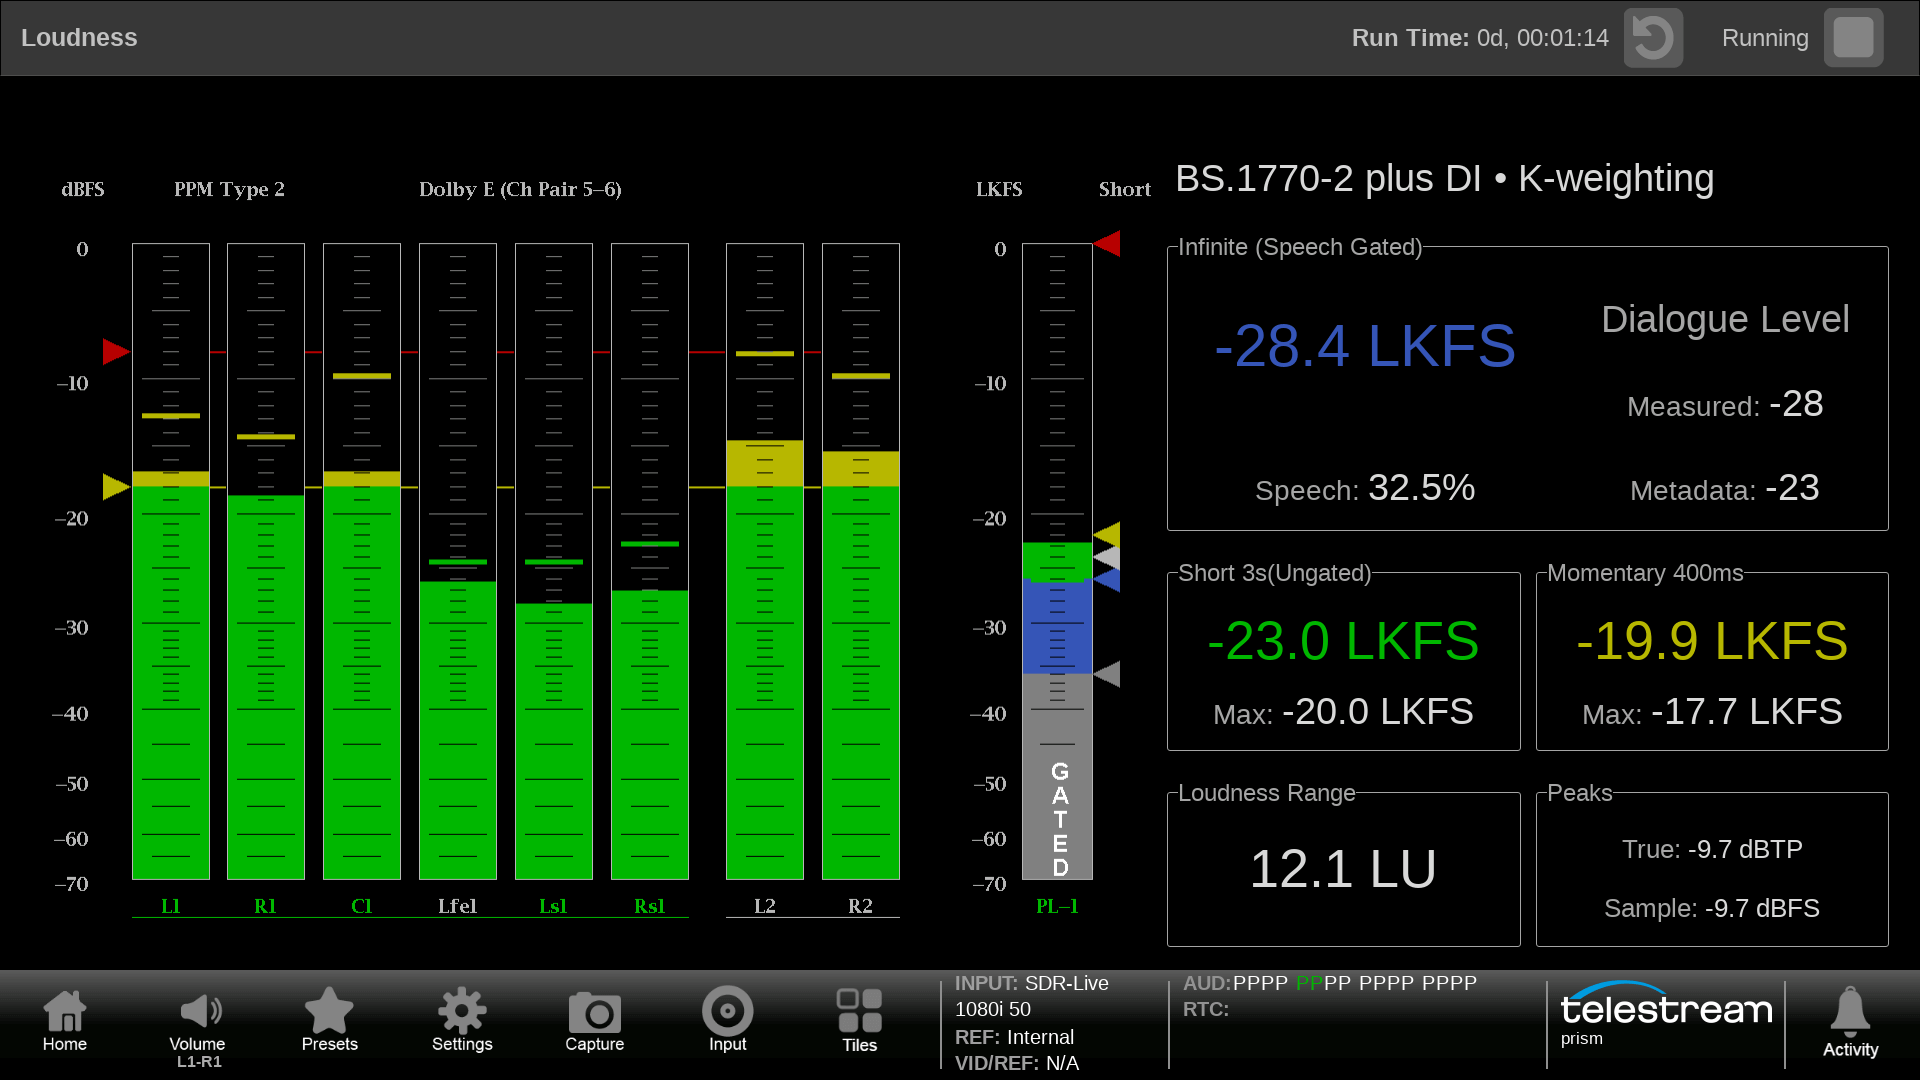
The Loudness measurement can sum a number of audio bars to produce the overall short and Infinite loudness values. Configurations are available for EBU R128 or ATSC A/85 with or without Dialog Intelligence. Option DLBY is required to decode Dolby E and D/D+ formats.
The RTW Surround sound display is available with option SRND. This display provides level and phase information for the interaction of multi-channel audio for Left, Right , Center, Left and Right Surround channels.
The RTW Surround sound display for 5.1.4 and 7.1.4 multi-channel audio displays Main / Upper bed display with dominance indicator in a tile.
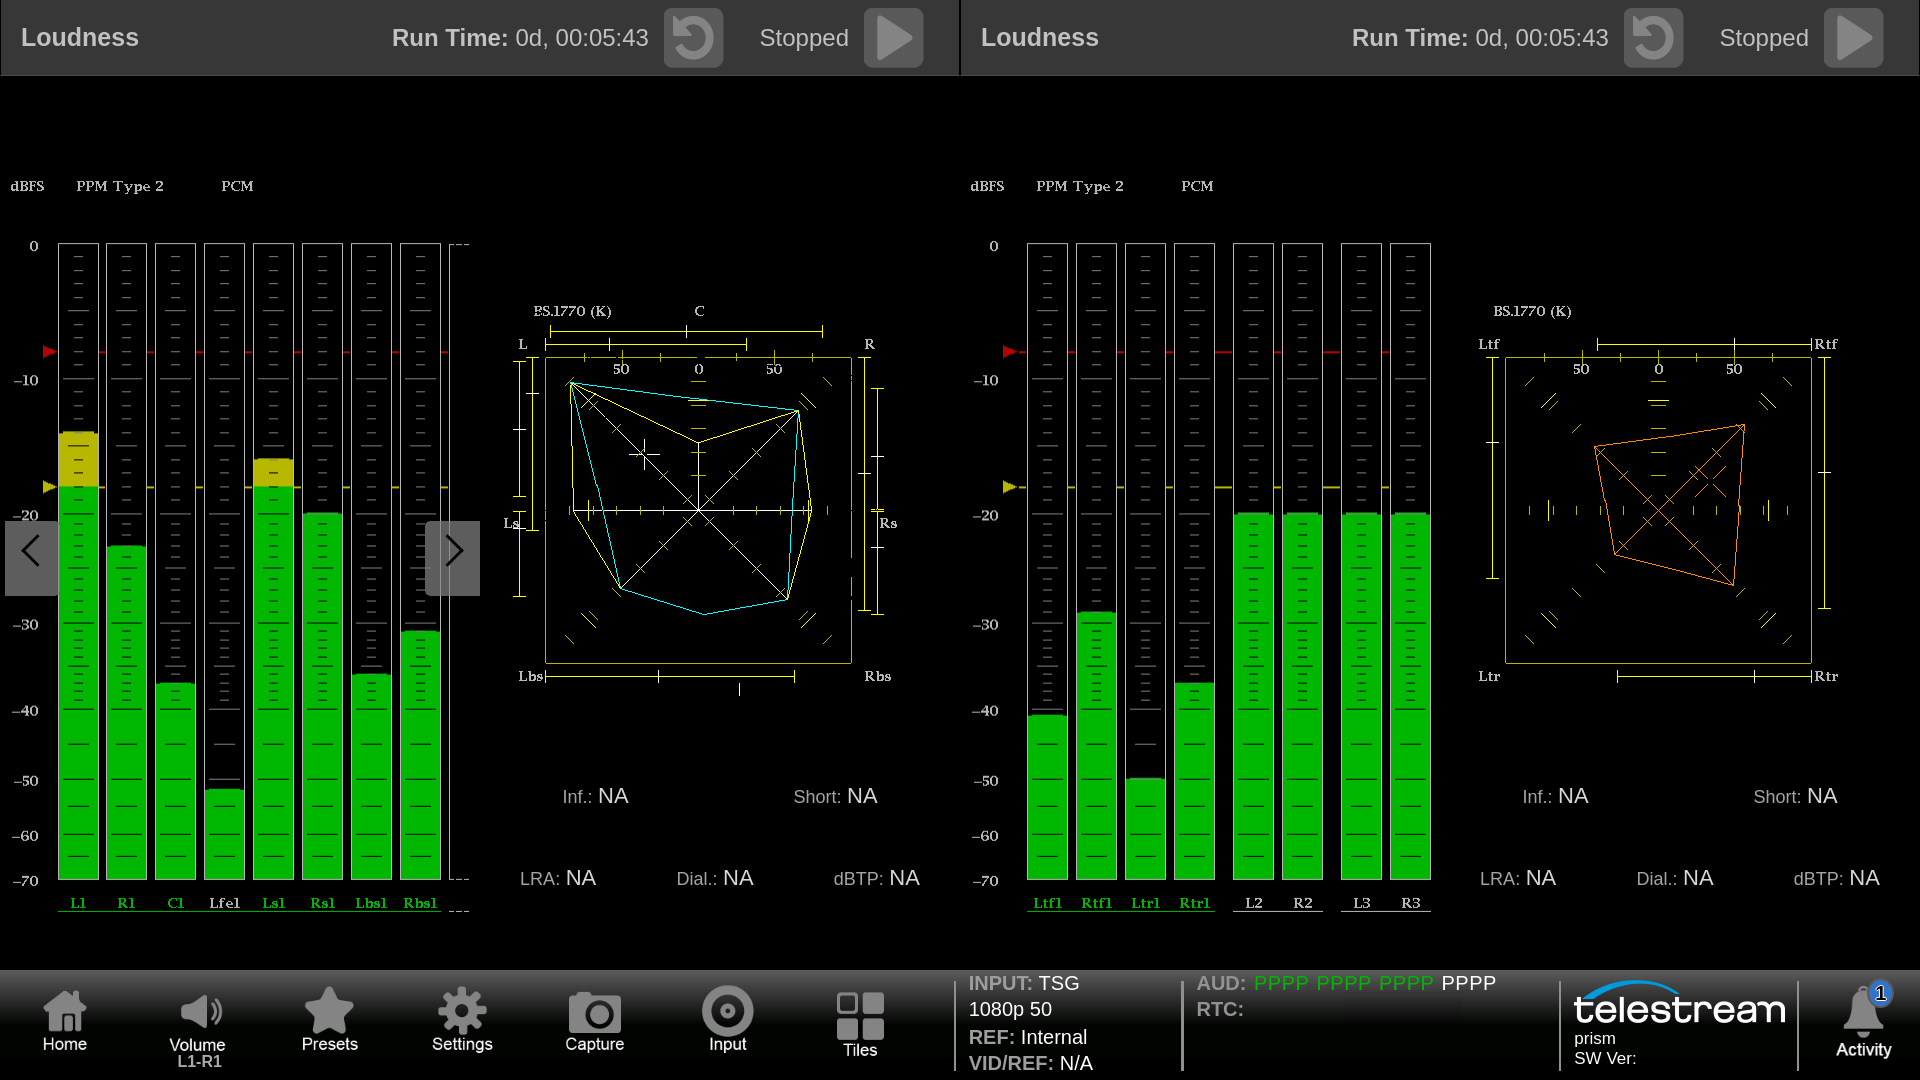
Audio display can be selected in two tiles to display Main / Upper bed display separately for intuitive immersive audio monitoring.
Event Log
Event Log shows a list of information related to Alarm events or status information that can be logged relative to Timecode or Precision Time Protocol (PTP).
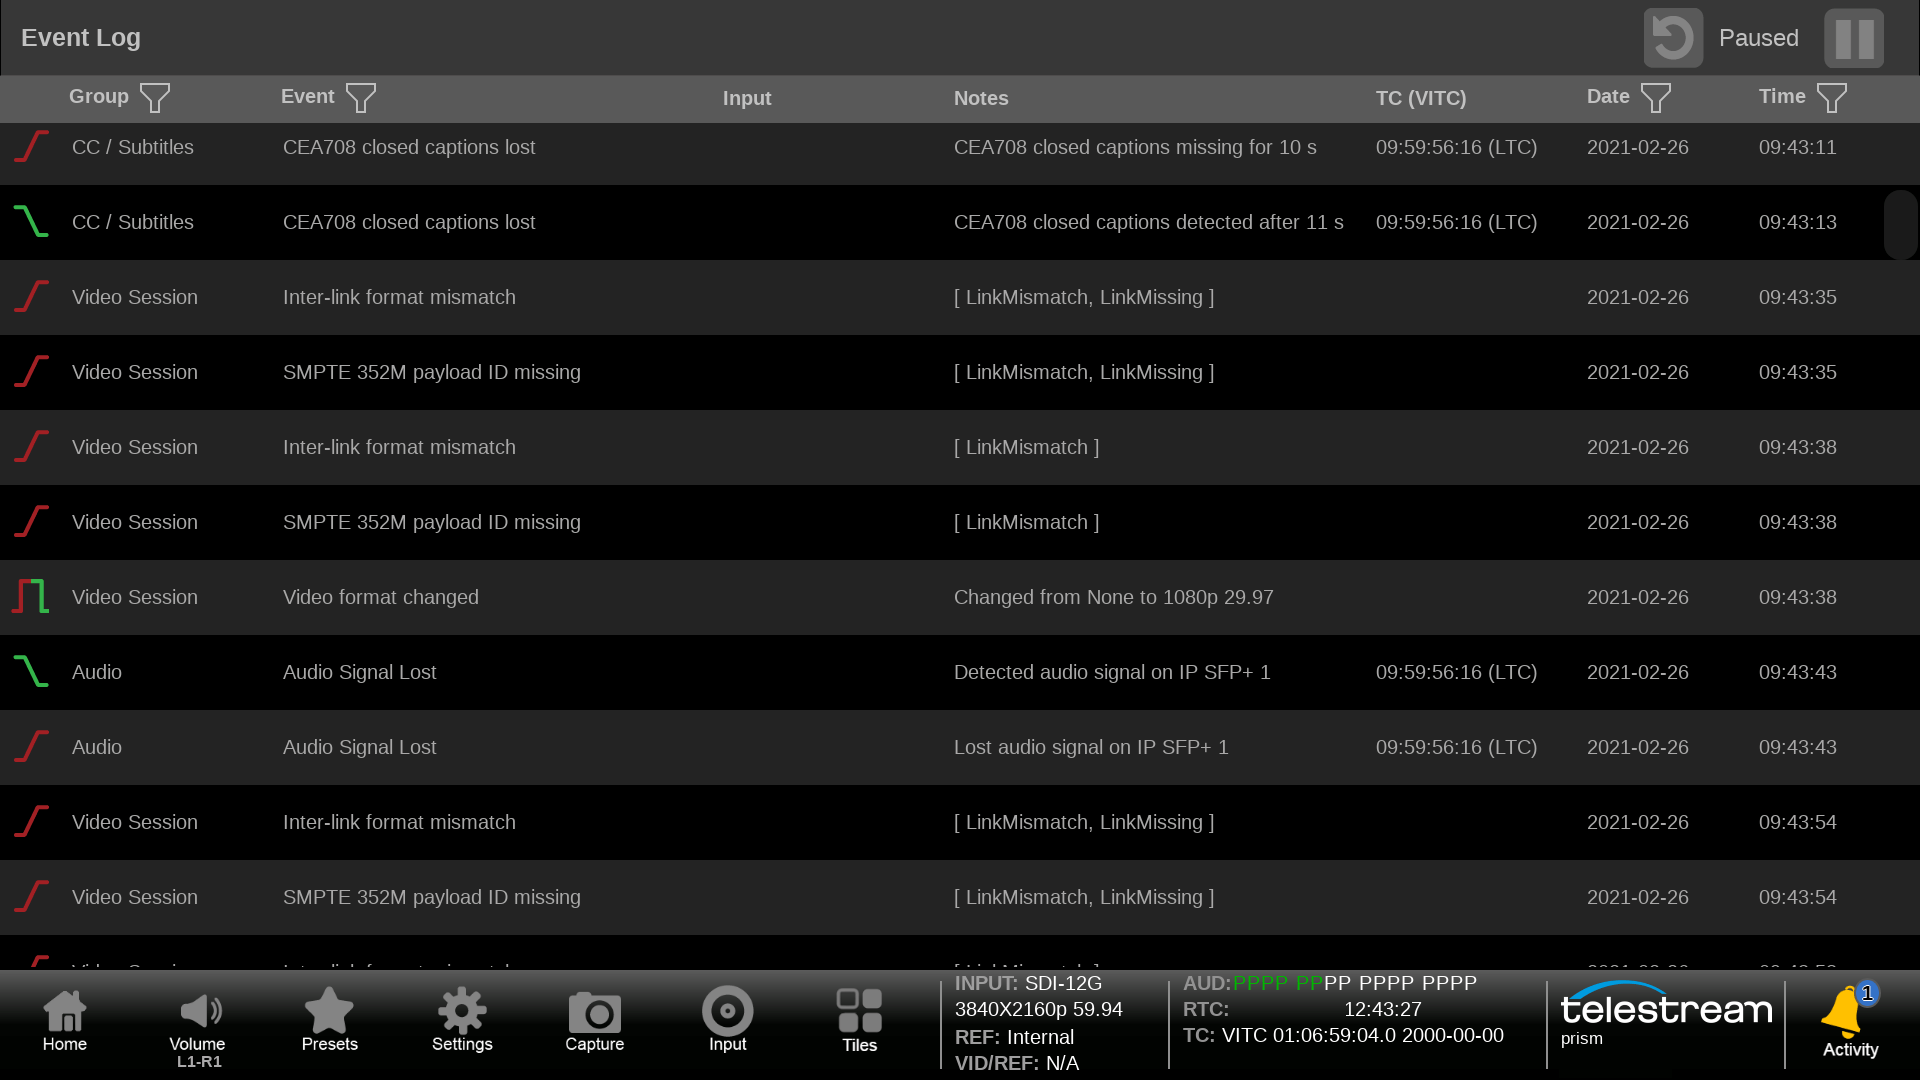
General list of events related to timecode. The Activity icon provides a Dashboard of Alarms with simple green, yellow and red indicators to show the current status of these values.
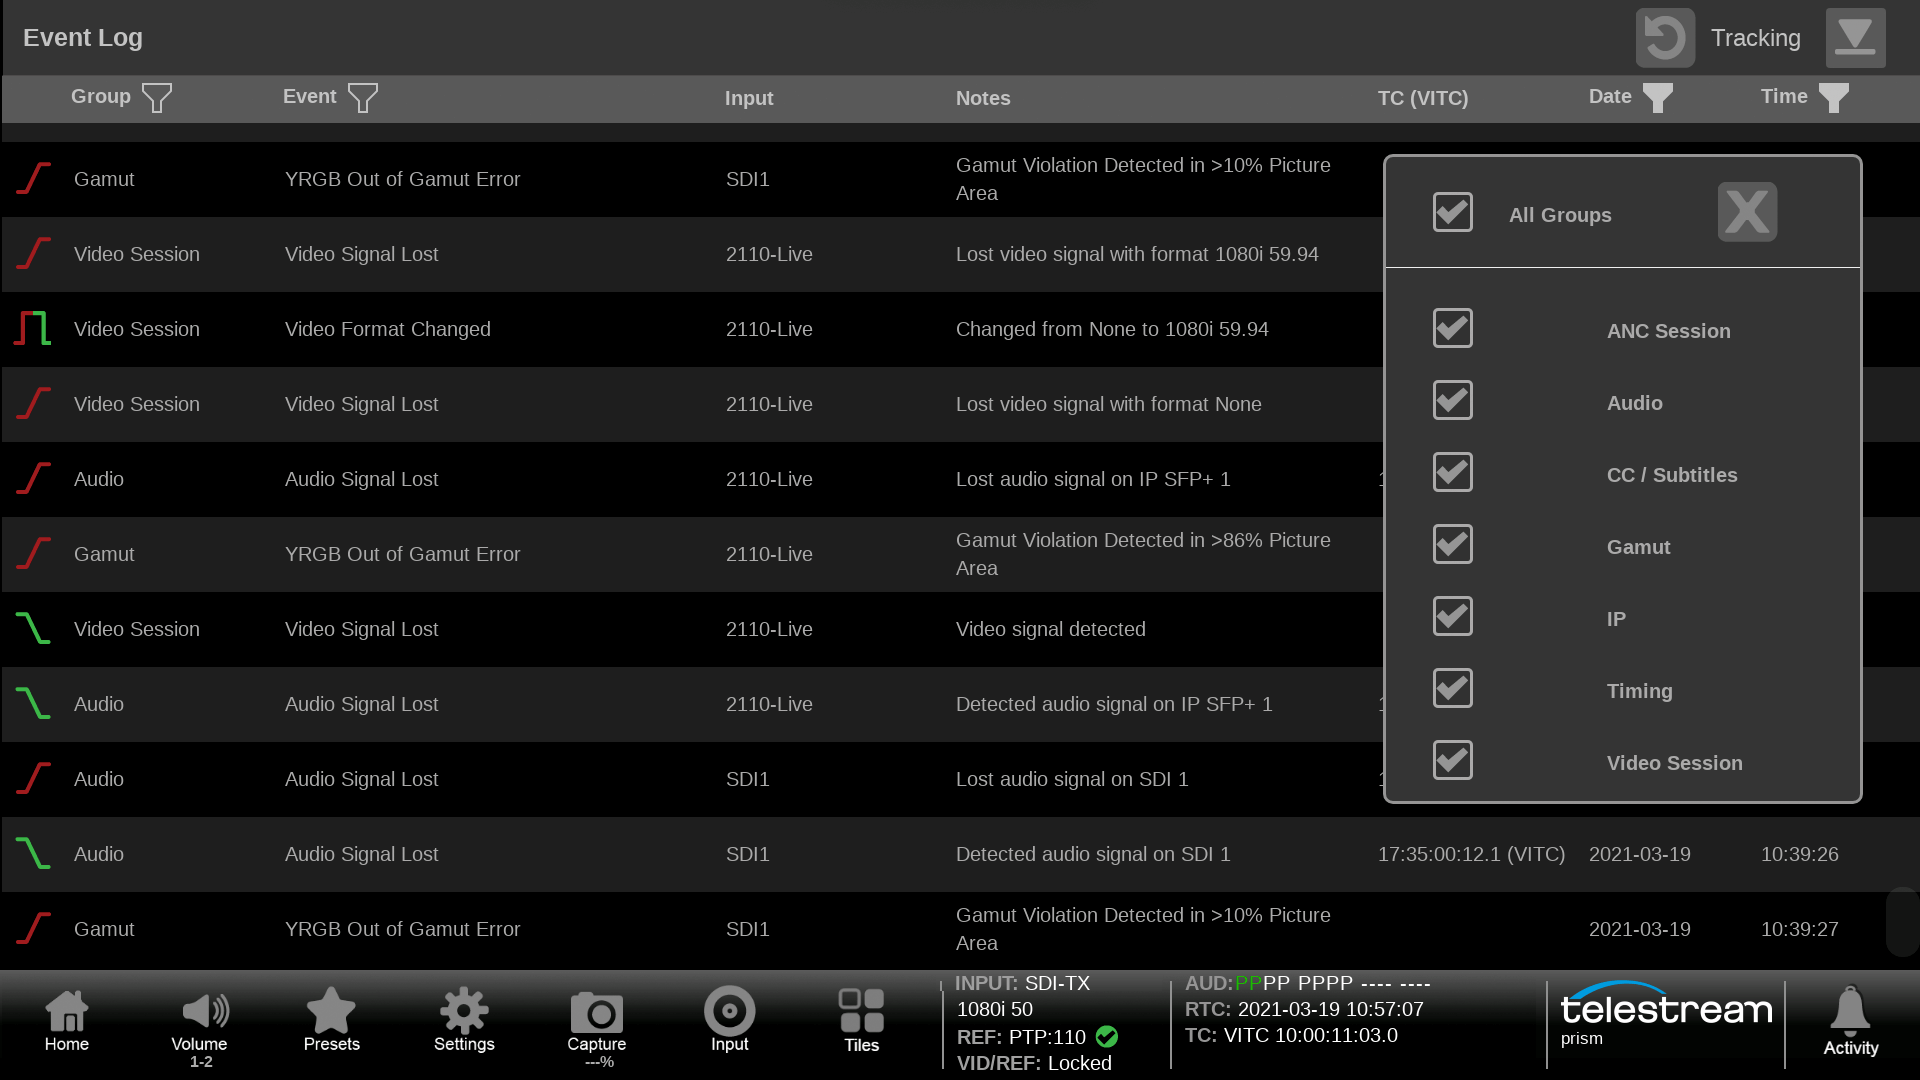
Ability to sort this list relative to Groups or Events that allows the user to specify an alarm of interest and determine when they occurred.
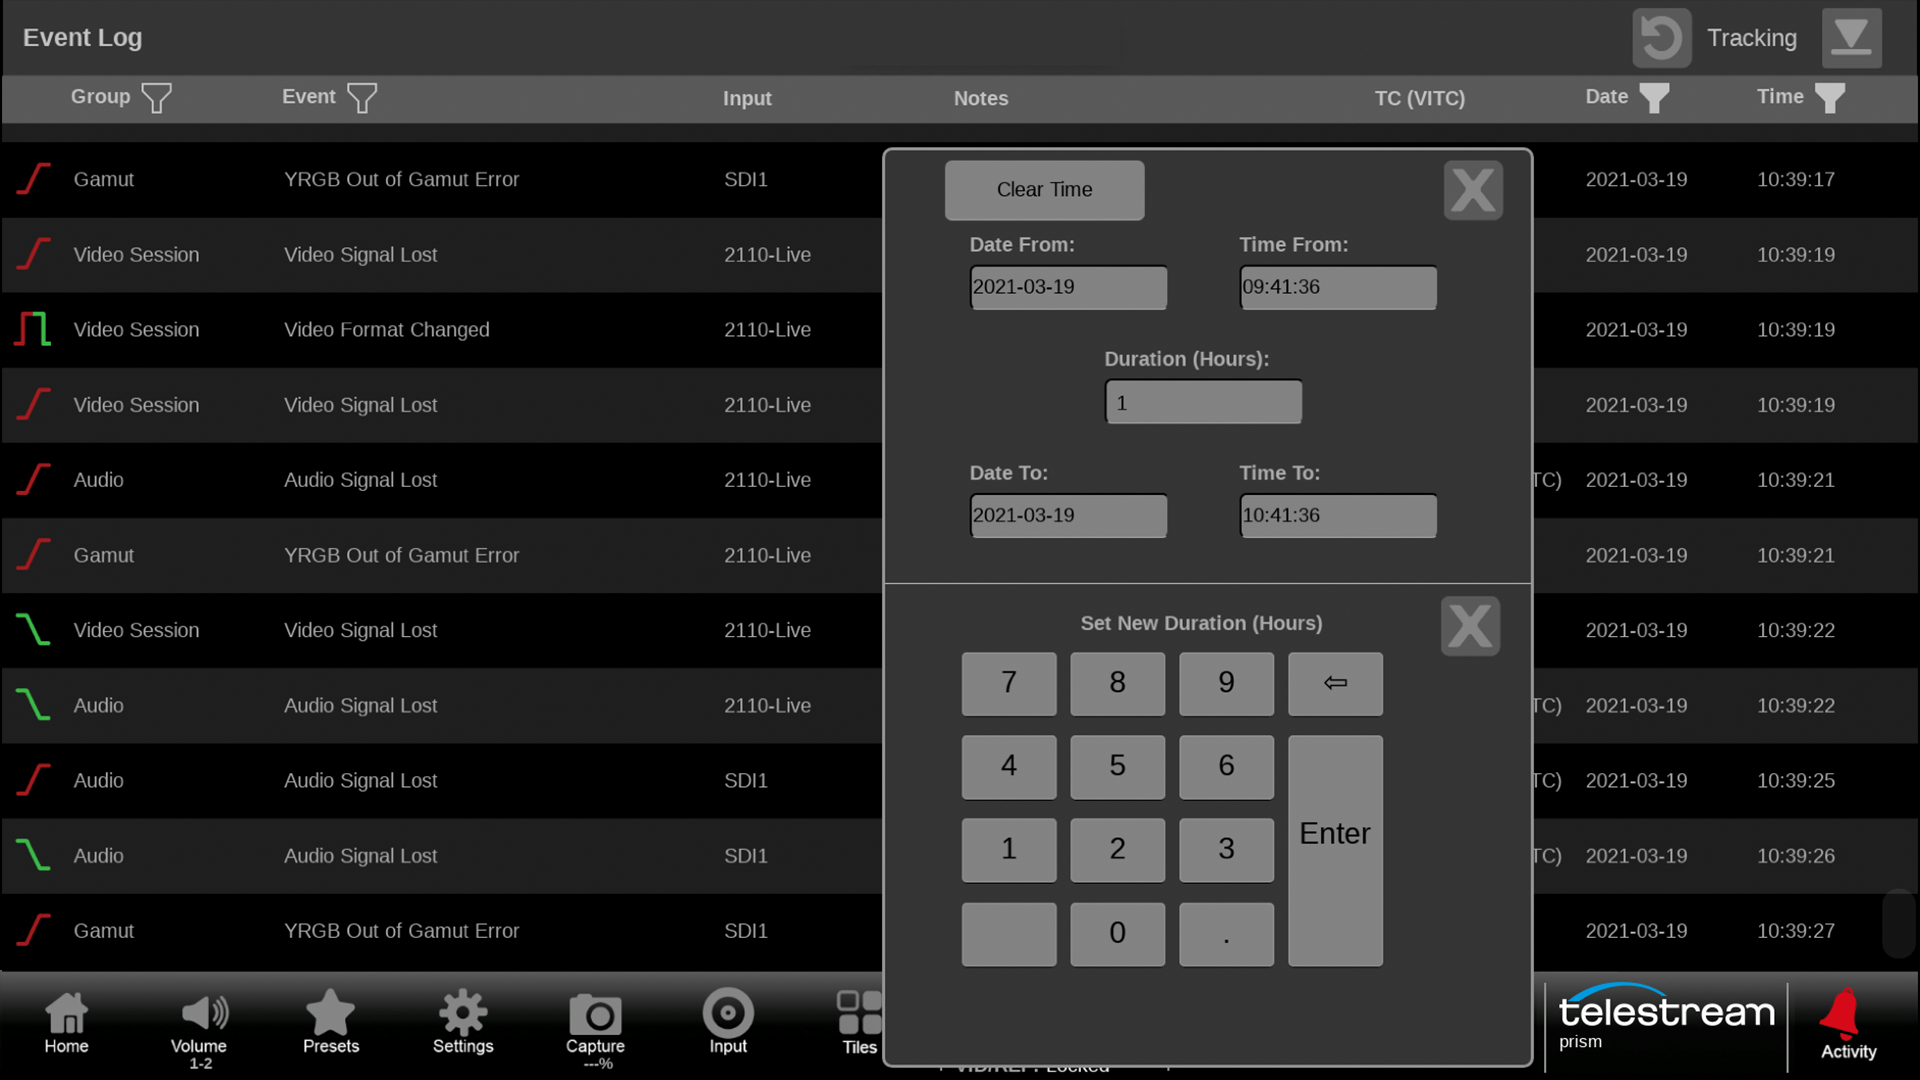
Ability to sort the list over a duration of time so the user can look at the last hour of events.
Timing Display
The Timing Display provides an intuitive way to monitor the currently selected input video timing against a reference signal either Black Burst or Tri-level Sync or Precision Time Protocol (PTP).
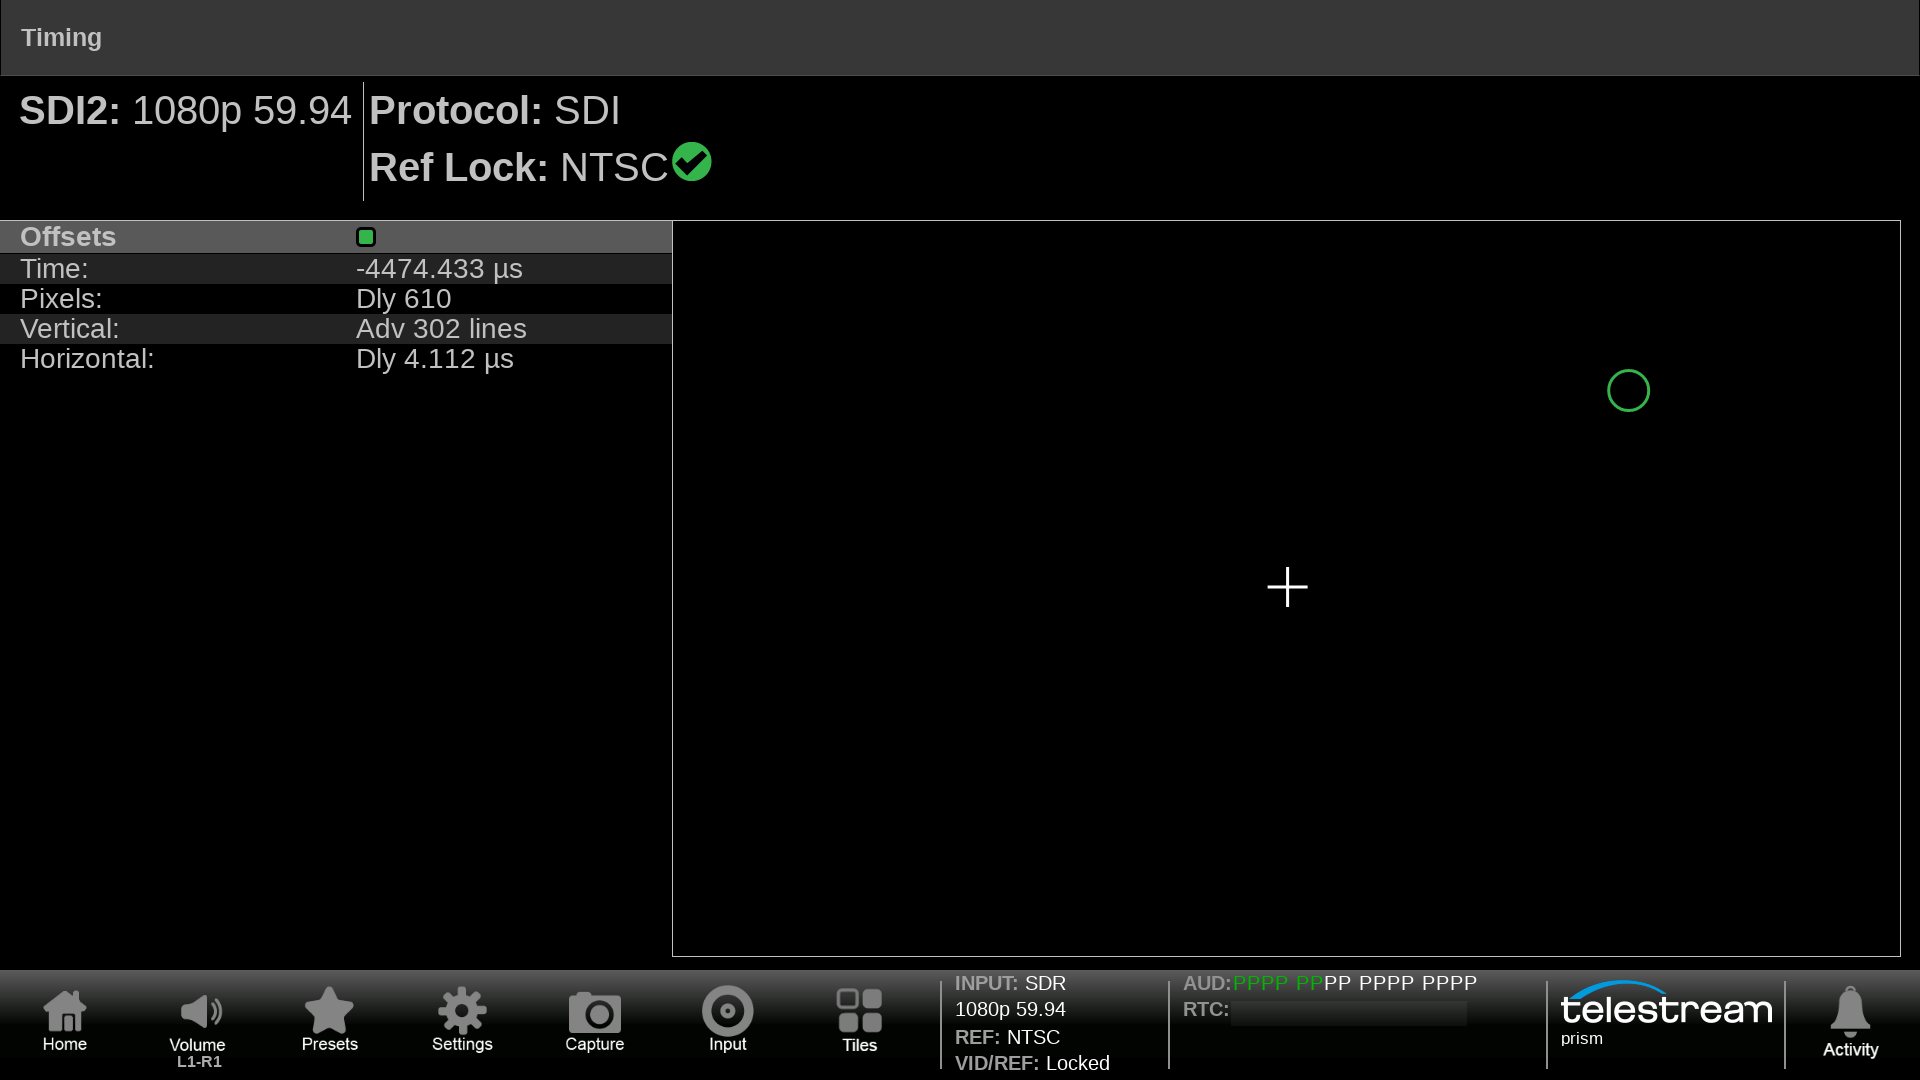
The Timing rectangle window represent the video frame. The Crosshairs shows the timing Center and the circle shows the offset timing of the input signal relative to the reference that is selectable between Black Burst, Tri-Level Sync or Precision Time Protocol (PTP).
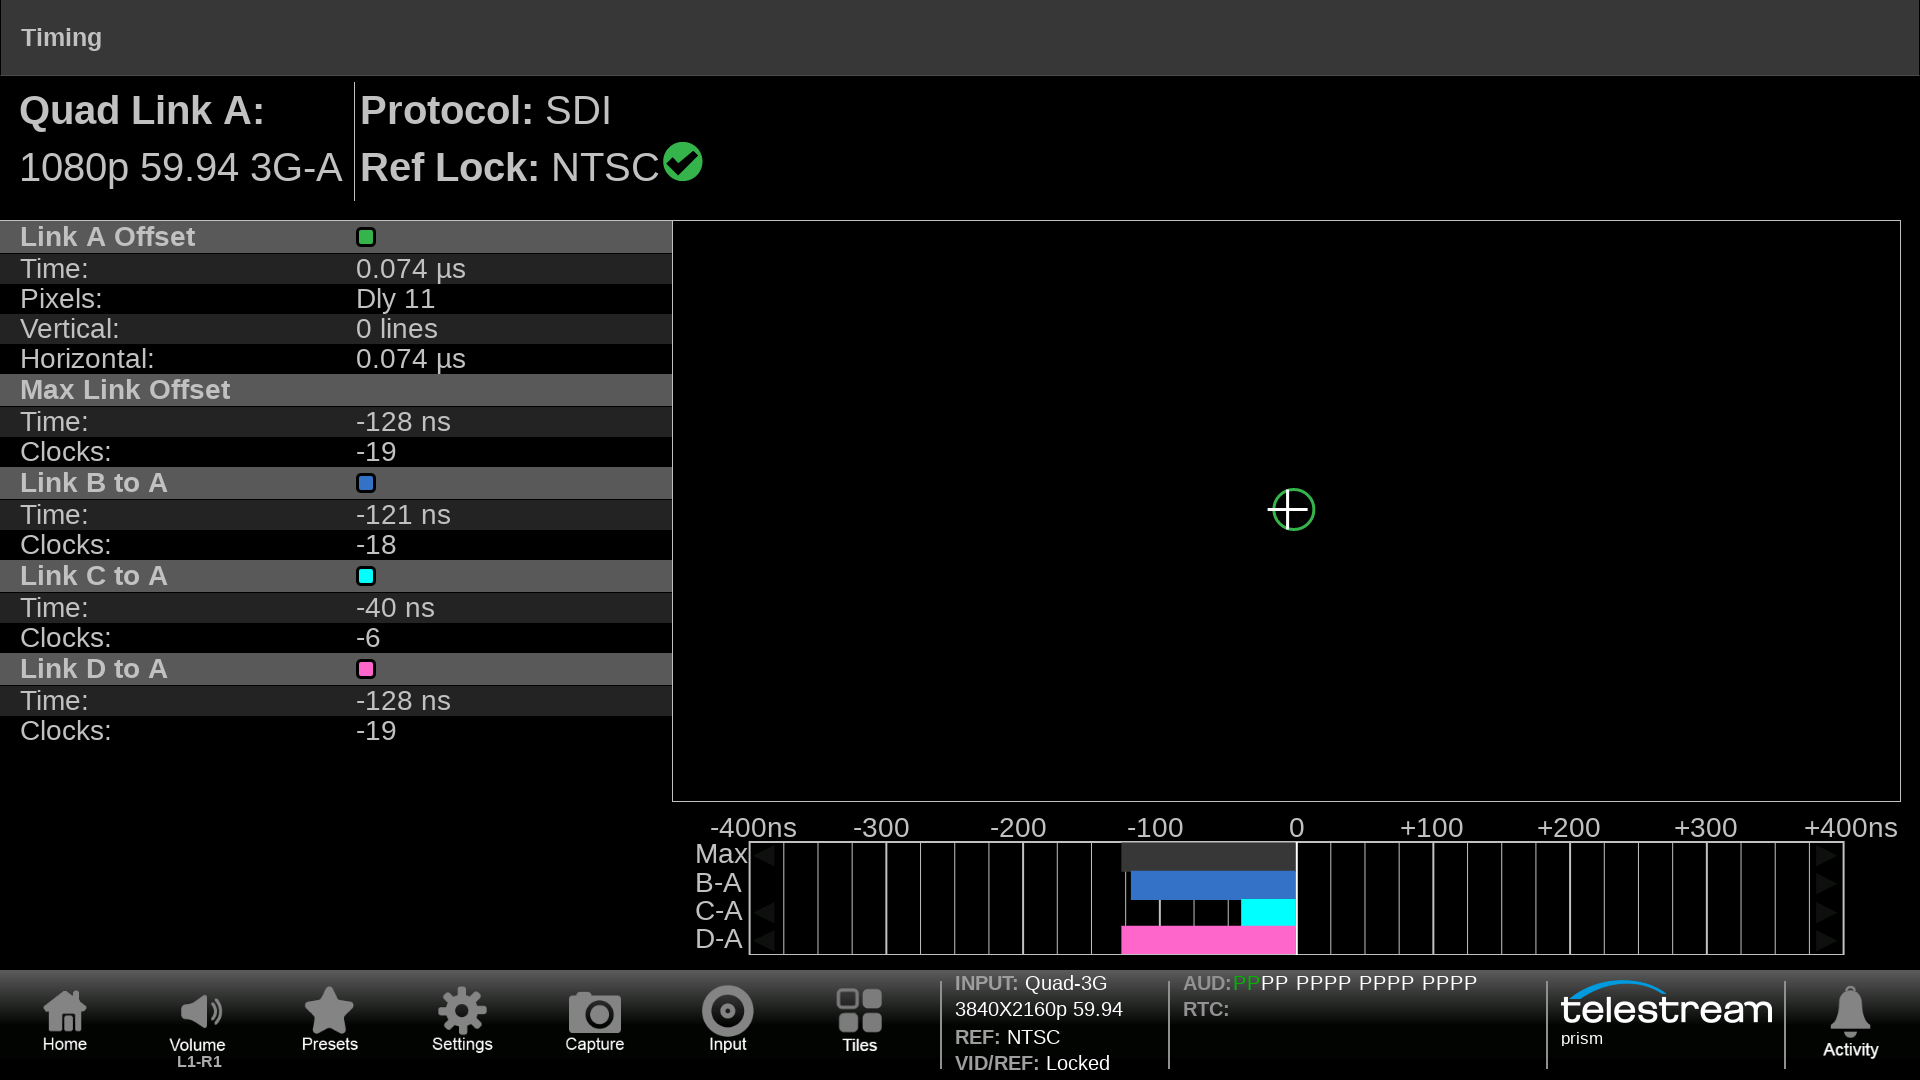
With Quad input the Inter-Channel Timing can be shown for the reference signal A against the other inputs B,C and D.
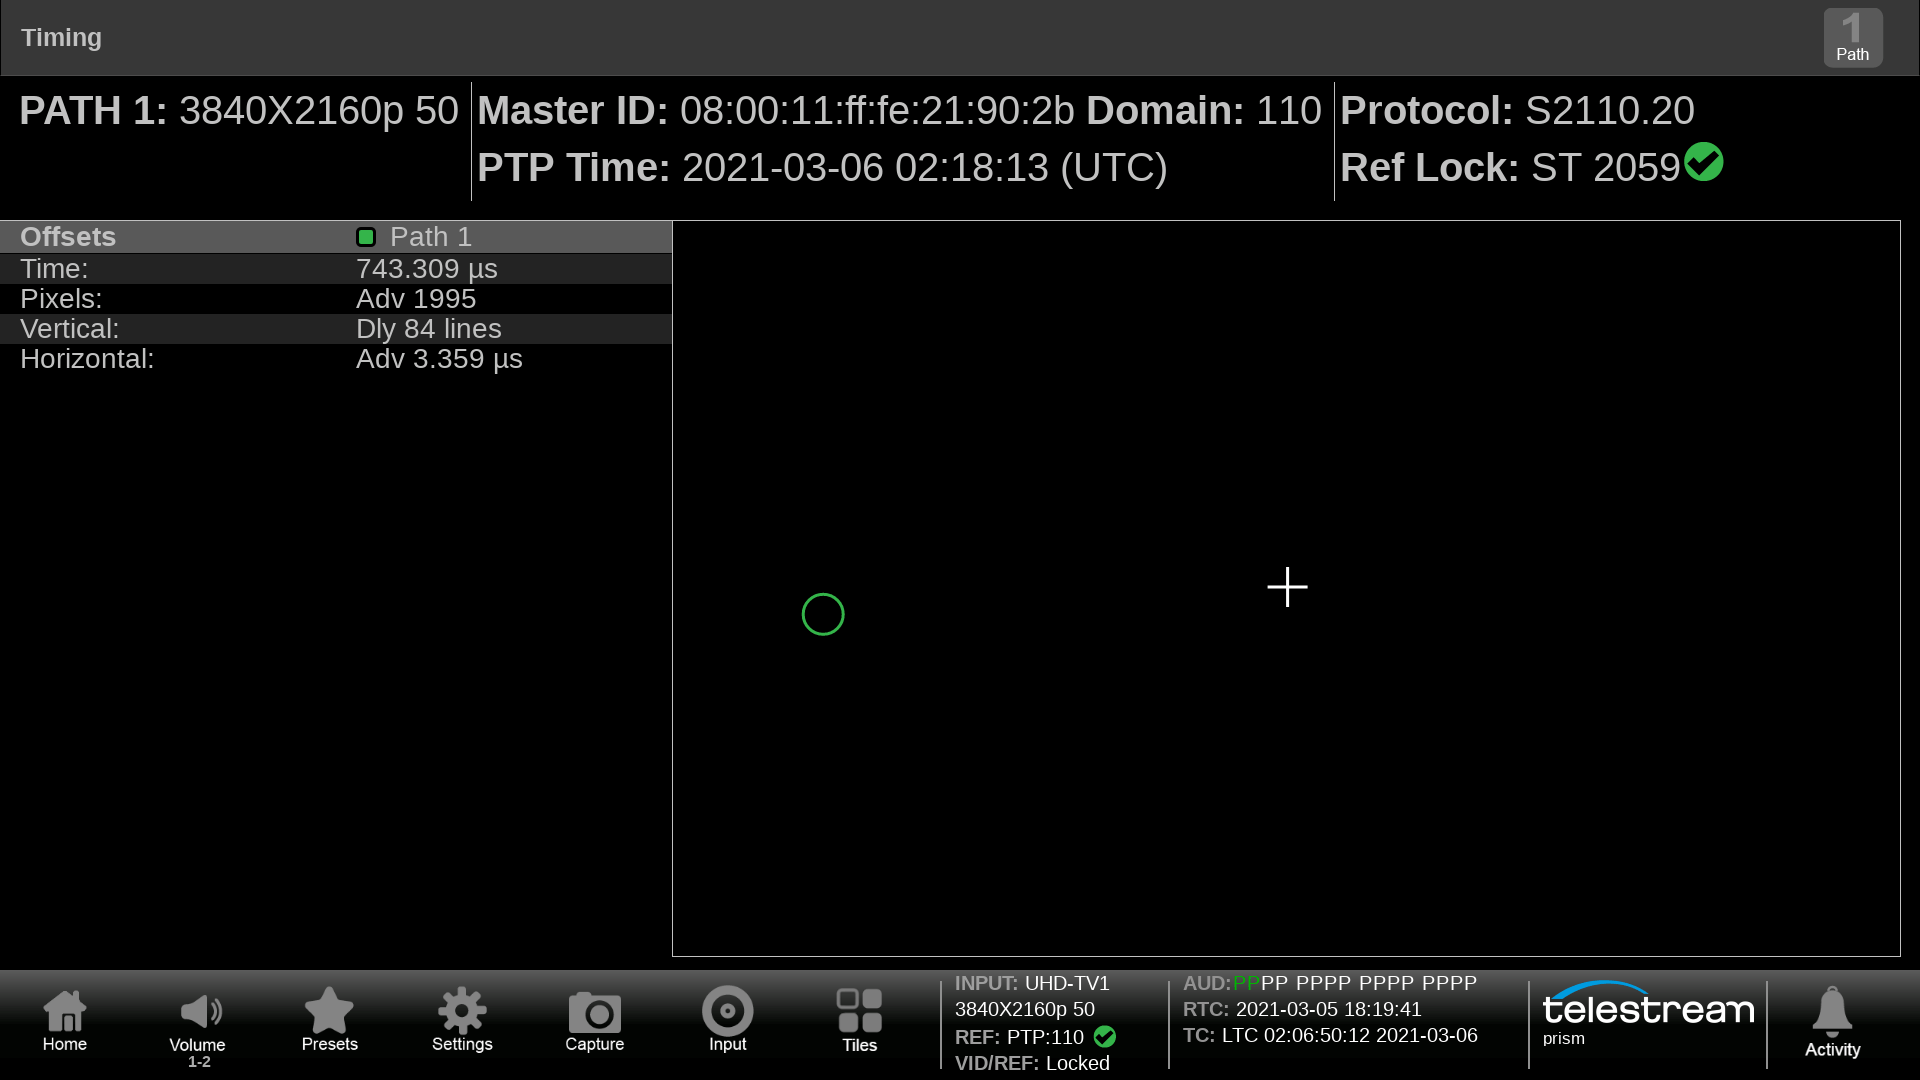
The Timing display can show the offset between the input signal and the reference. In this case we have IP input with a Precision Time Protocol reference showing Domain and Grandmaster ID.
External Reference
The External Reference display shows a trace of the currently applied analog reference input (NTSC, PAL or Tri-Level).
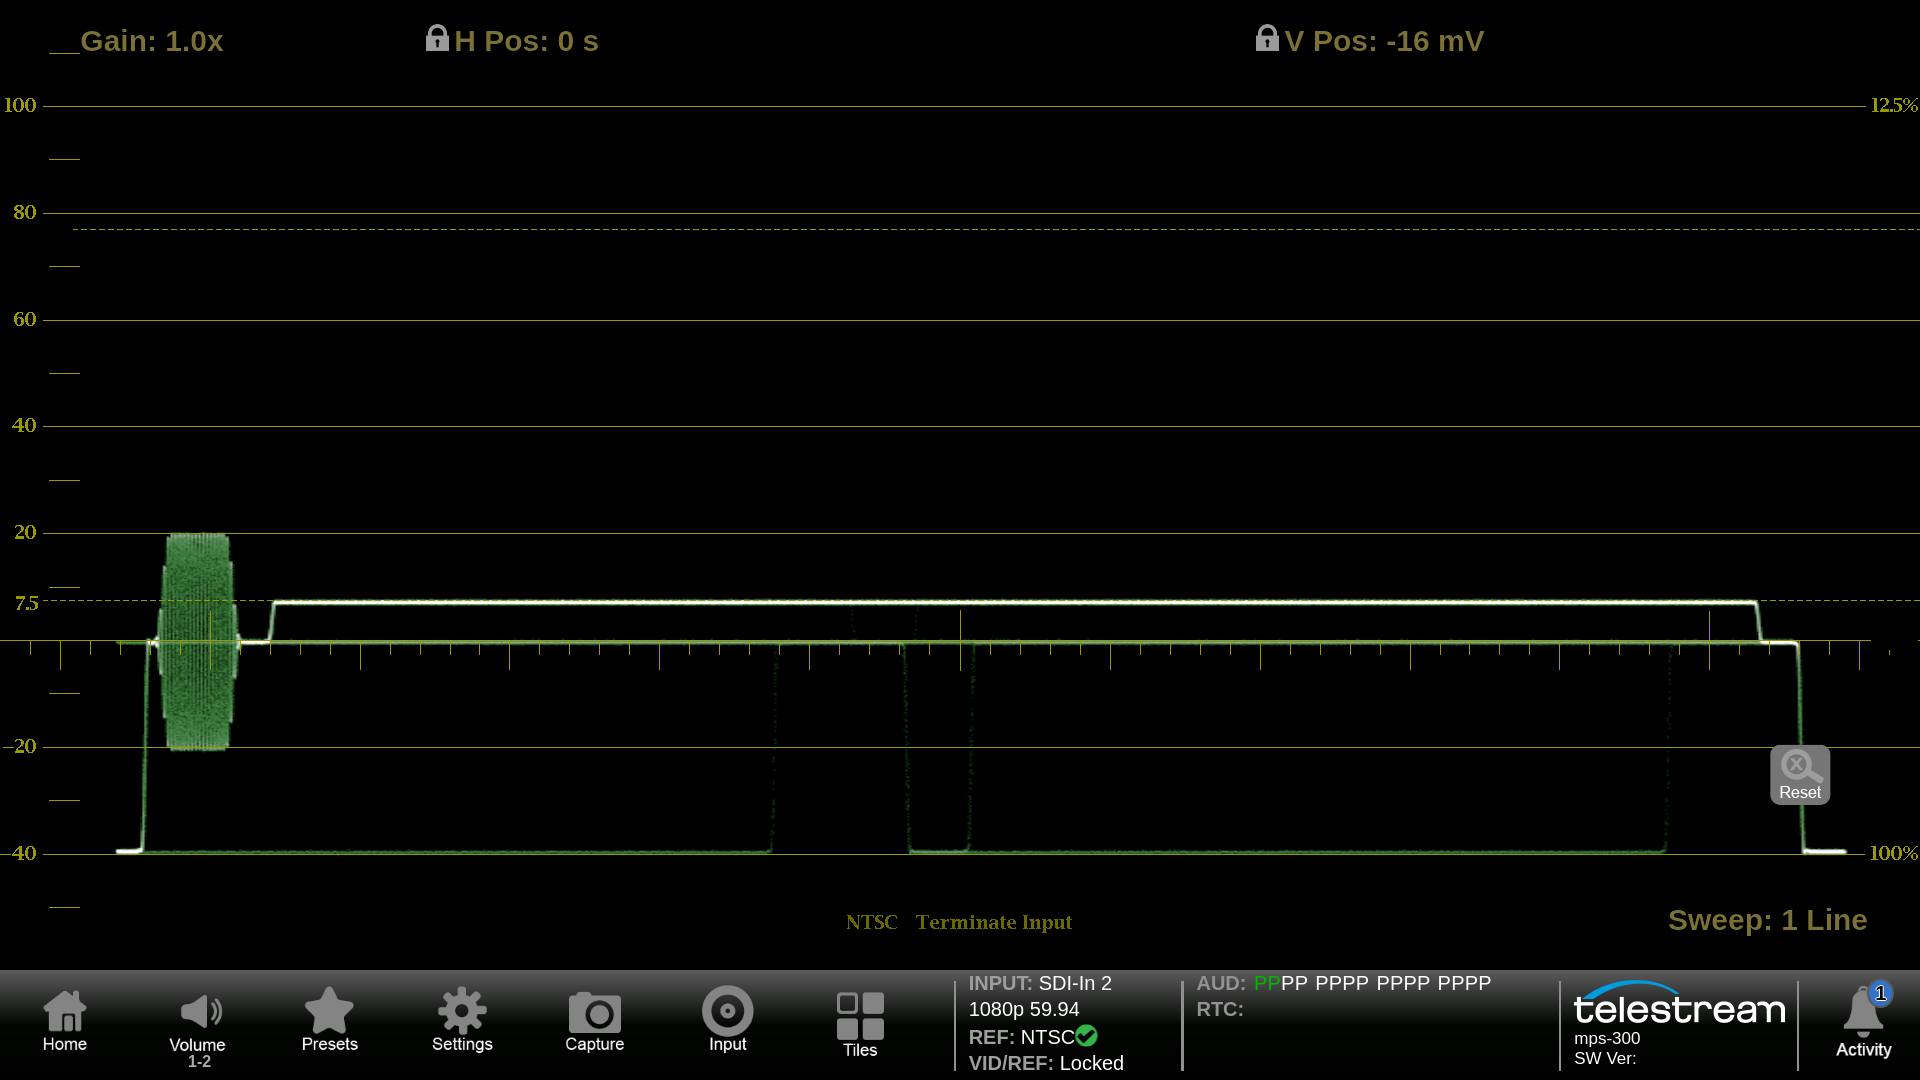
The External Reference display shows the trace of the currently applied analog reference input (REF IN) connected on the rear of the instrument. The user can select various sweep, gain and mag modes. In this case an NTSC one-line sweep is shown with 1.0 gain.
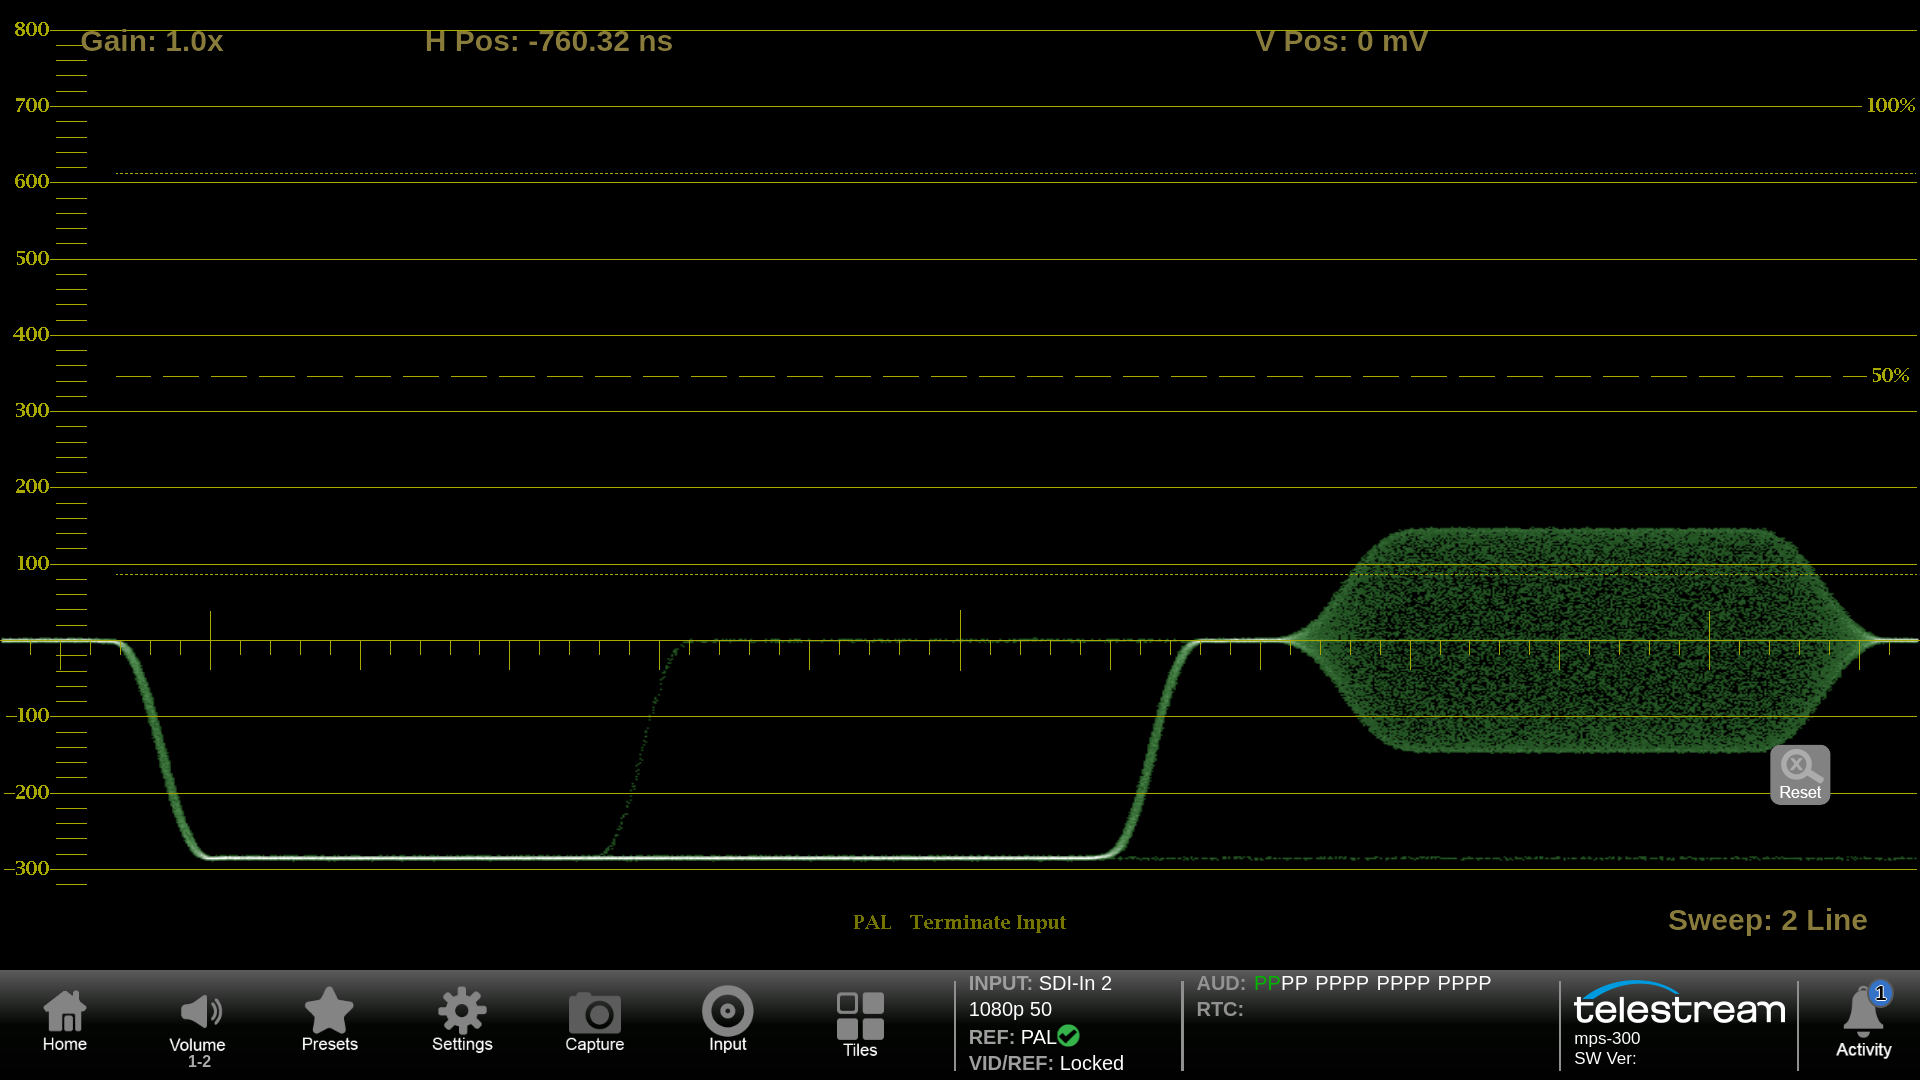
The External Reference display allows the user to verify the type of reference applied and the signal level to ensure the reference is compliant. In this case a two-line Mag of the PAL reference can be used to check timing and level of the sync signal.
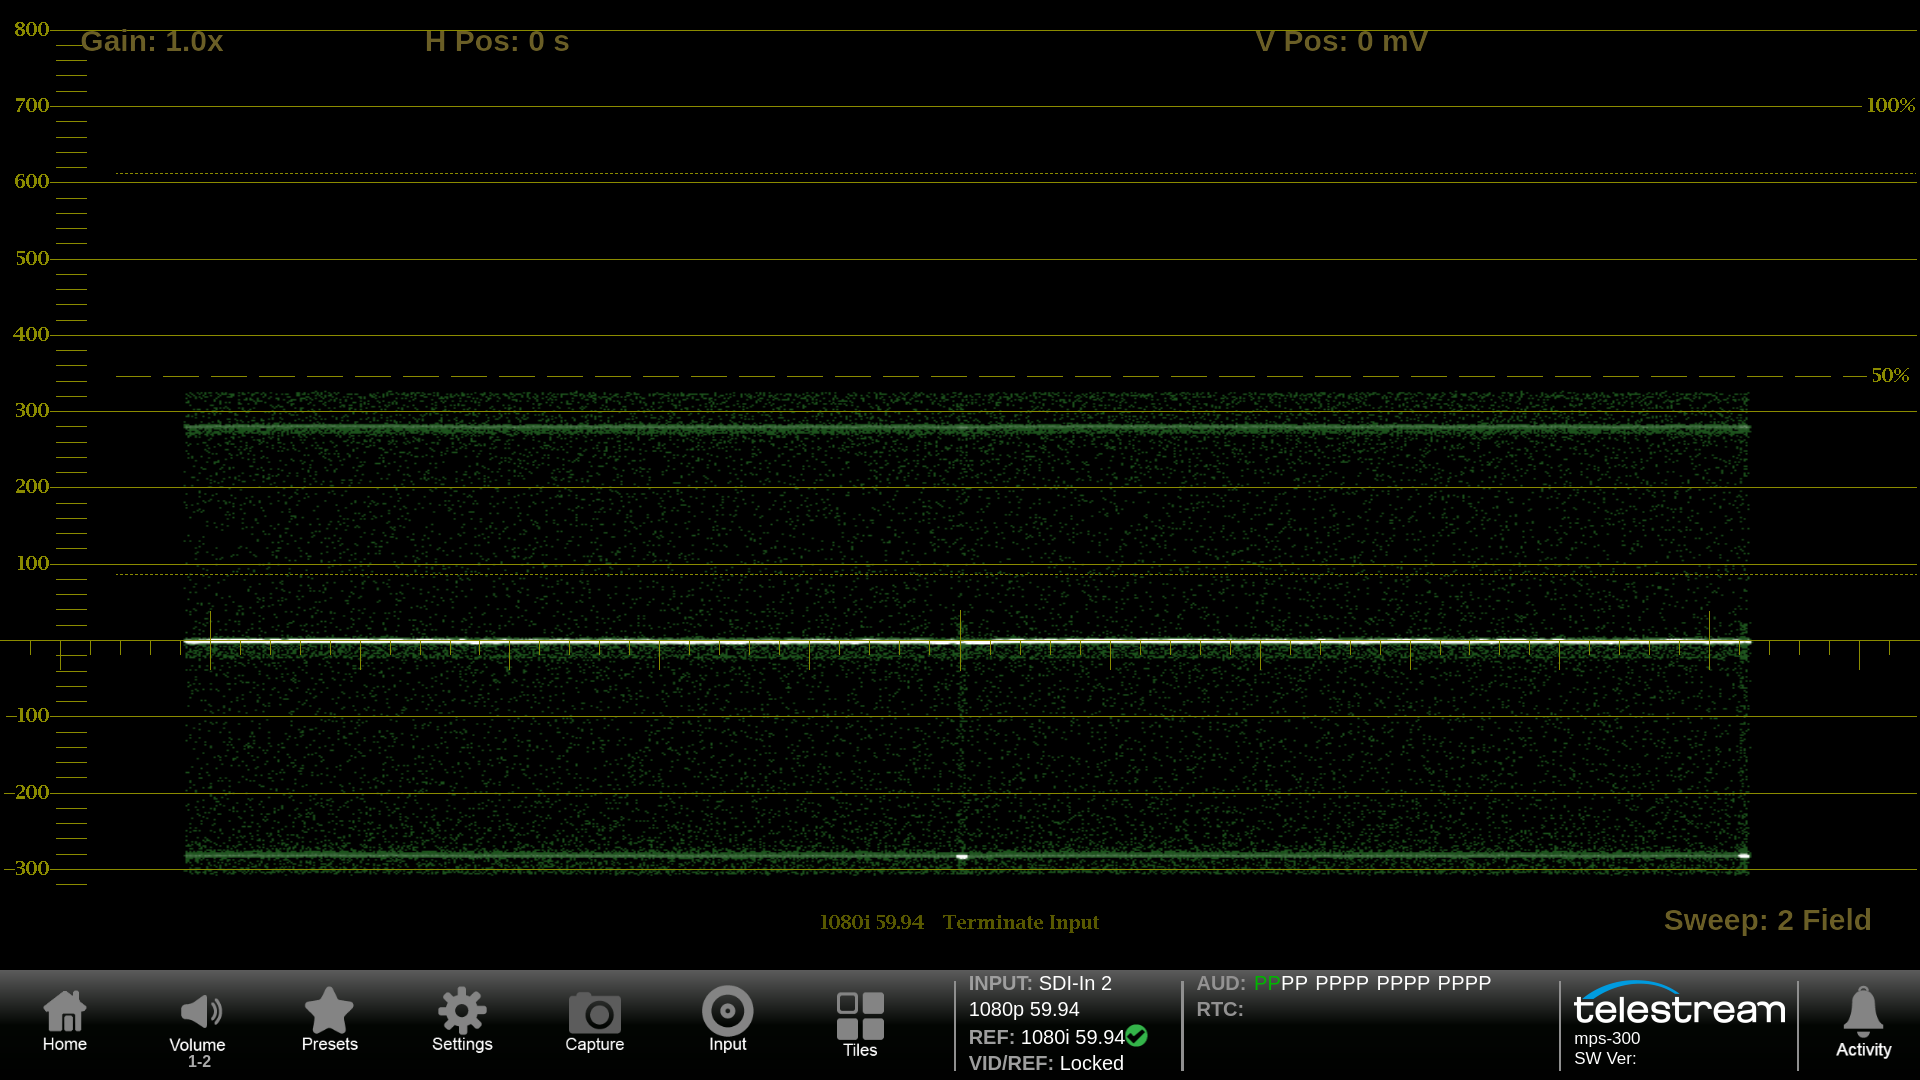
A two-field sweep has been selected for this Tri-Level sync signal so that the user can check for any variation in the signal amplitude that would show any hum present on the reference signal.
IP Status
IP Status display provides a simple monitoring of the IP streams present on SFP port 1 & 2 of PRISM and provides useful information on the type of streams present.
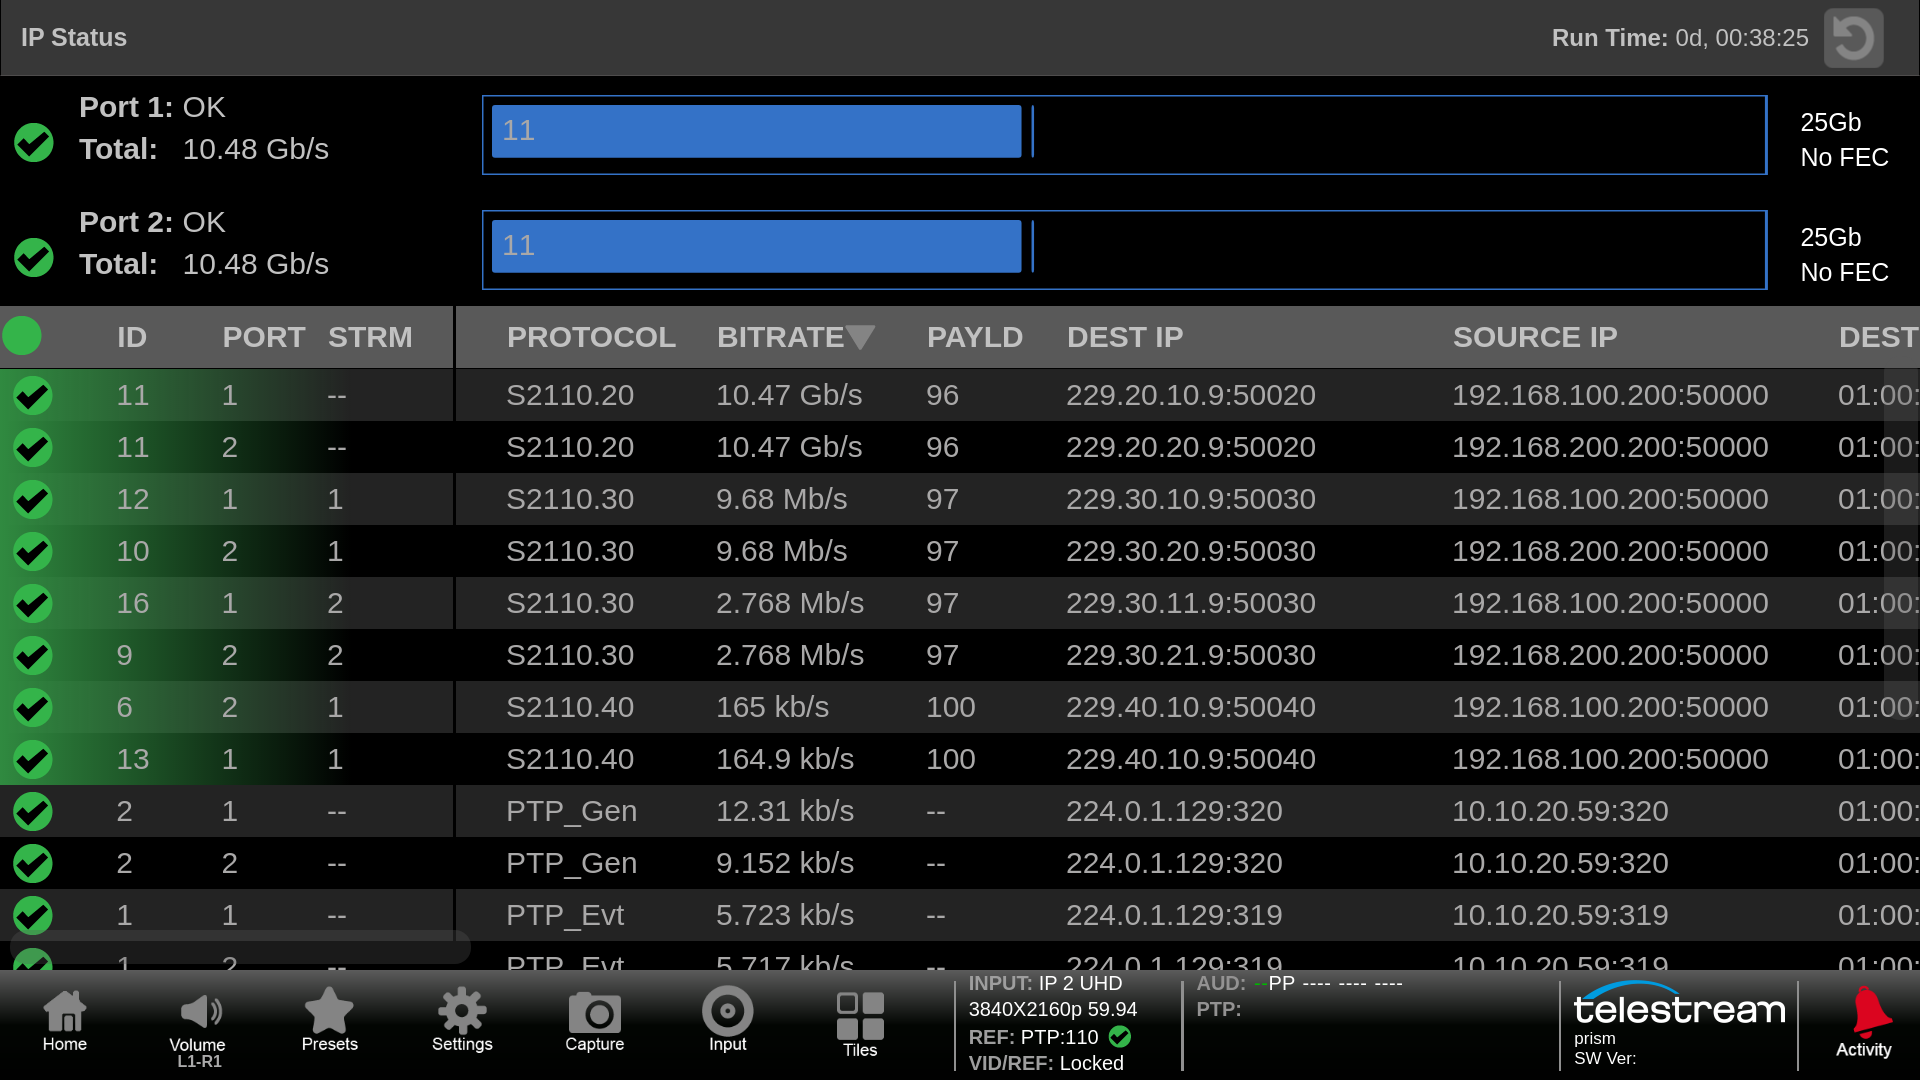
The IP Status provides indication of the amount of data used on each SFP Port 1 & 2. Simple Green, Yellow and Red indicators can alert the user to issues with a stream.
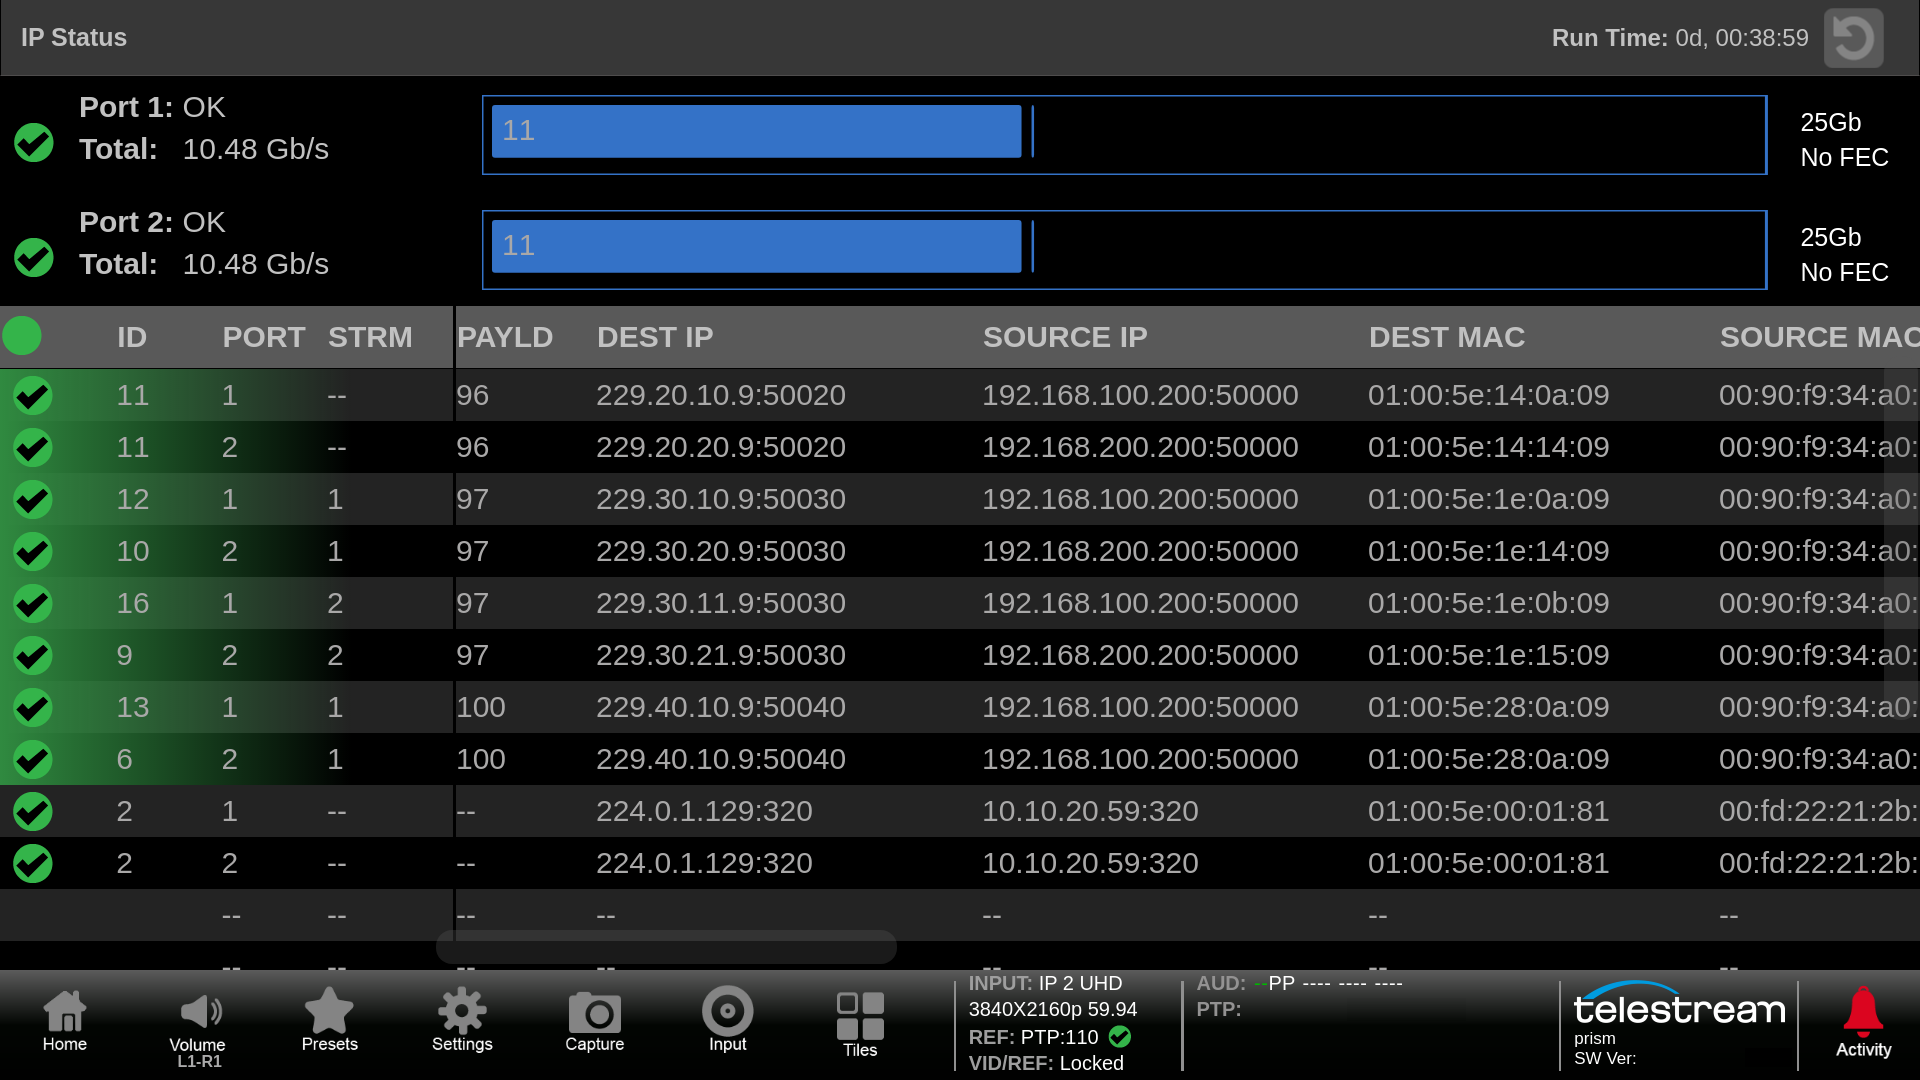
The IP Status provides information on Protocol, Bitrate, Payload Type, IP and MAC Addresses.
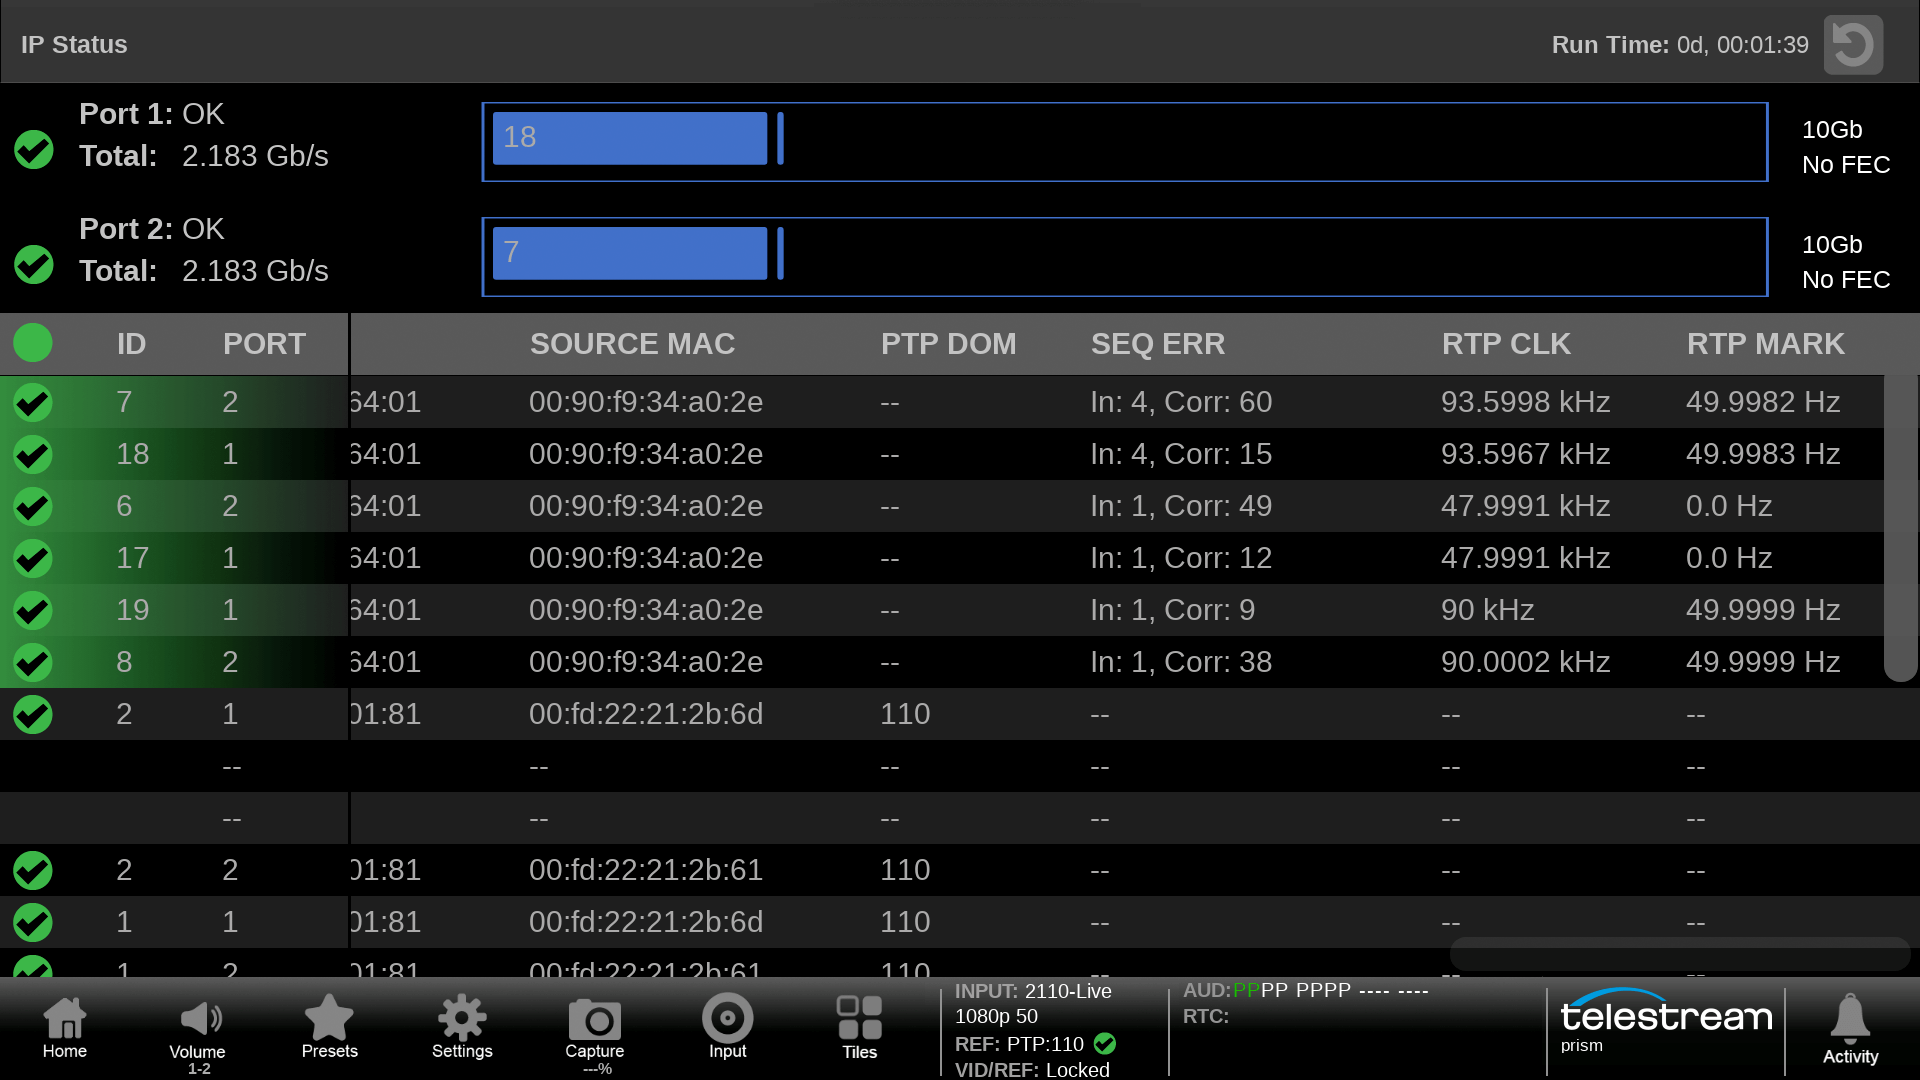
Scrolling to the right of the IP Status window shows PTP domain, RTP marker frequency.
IP Session
IP Session shows information for Layer 1 & 2, Video, Audio, Data, PTP and NMOS. The user can verify data streams and check syntax information. Requires option IP-MEAS to be installed in the instrument.
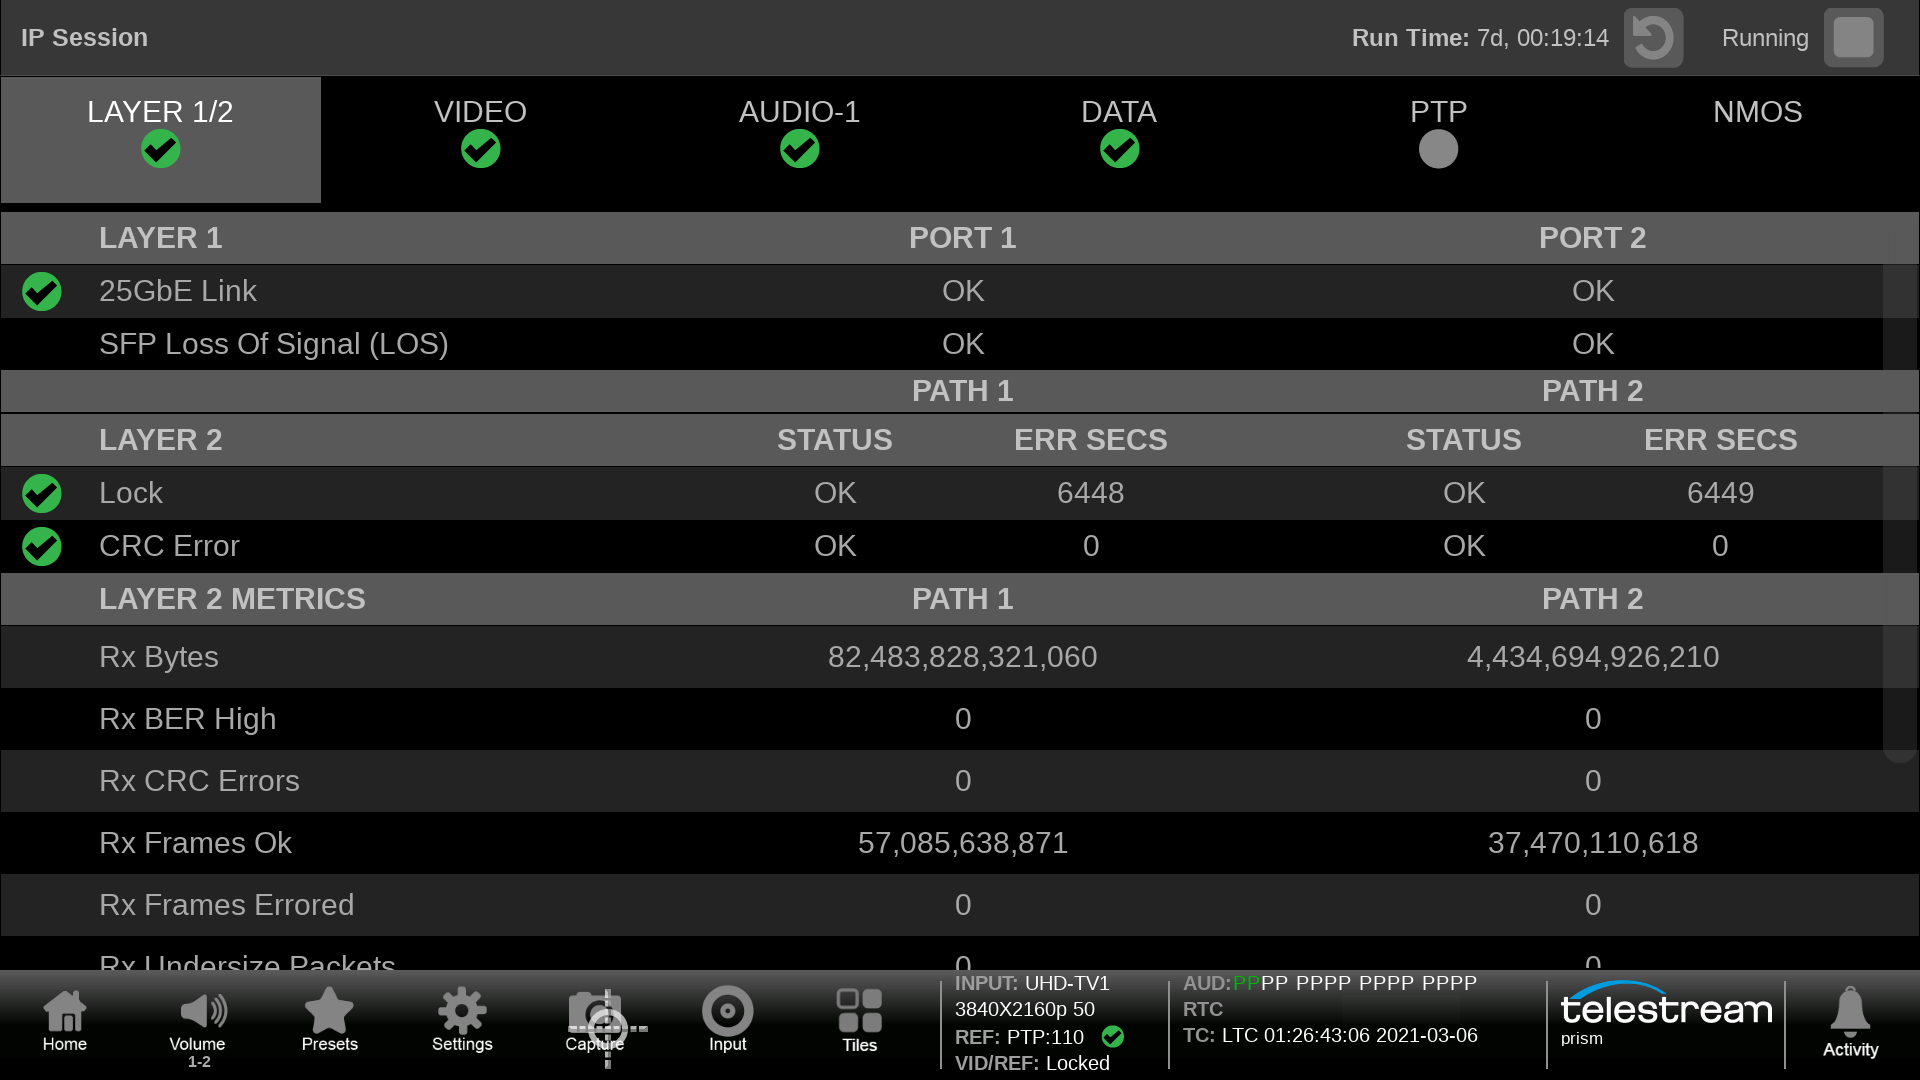
The Layer 1 & 2 show link status along with Layer 2 Metrics for Received Bytes, CRC Errors or Frames Errors and indication of Undersized Packets.
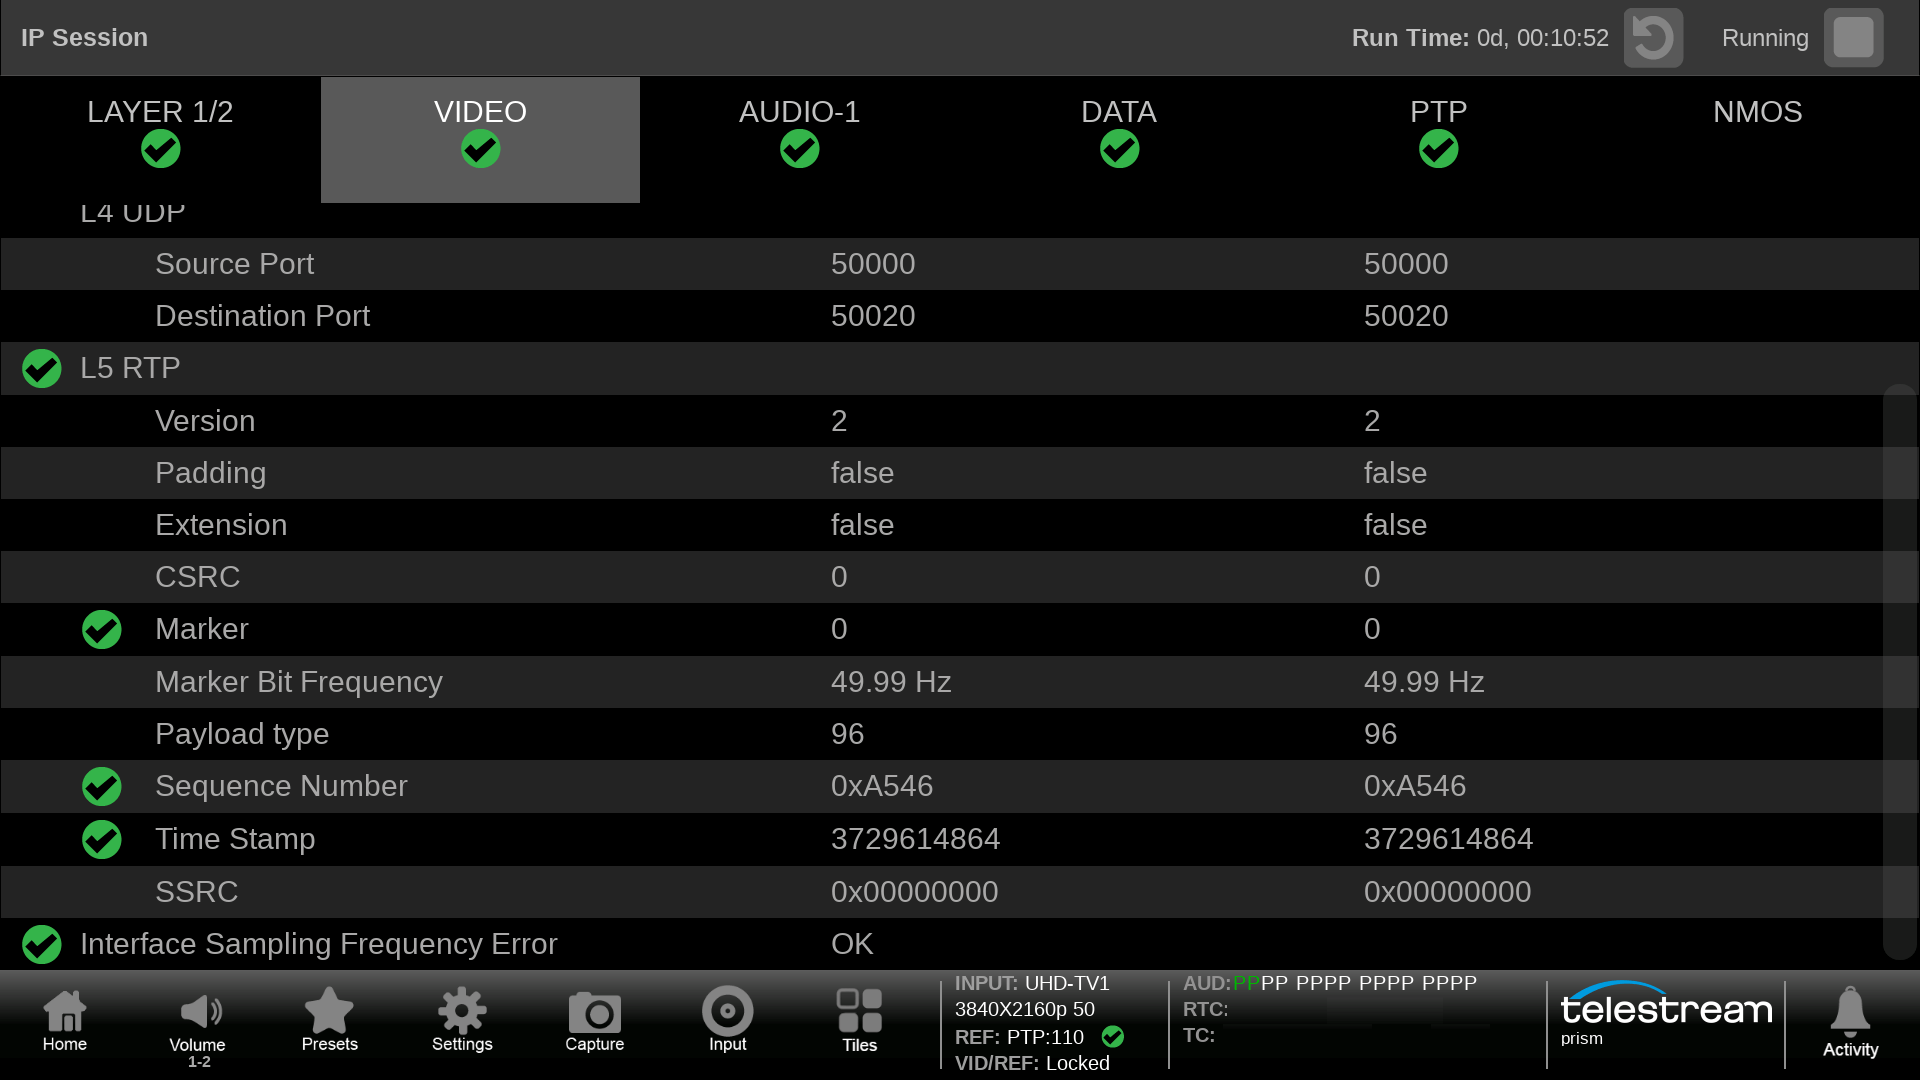
The Video tab shows IP address, port number and RTP Layer 5 information such as Marker, Payload Type, Sequence Number and Timestamp.
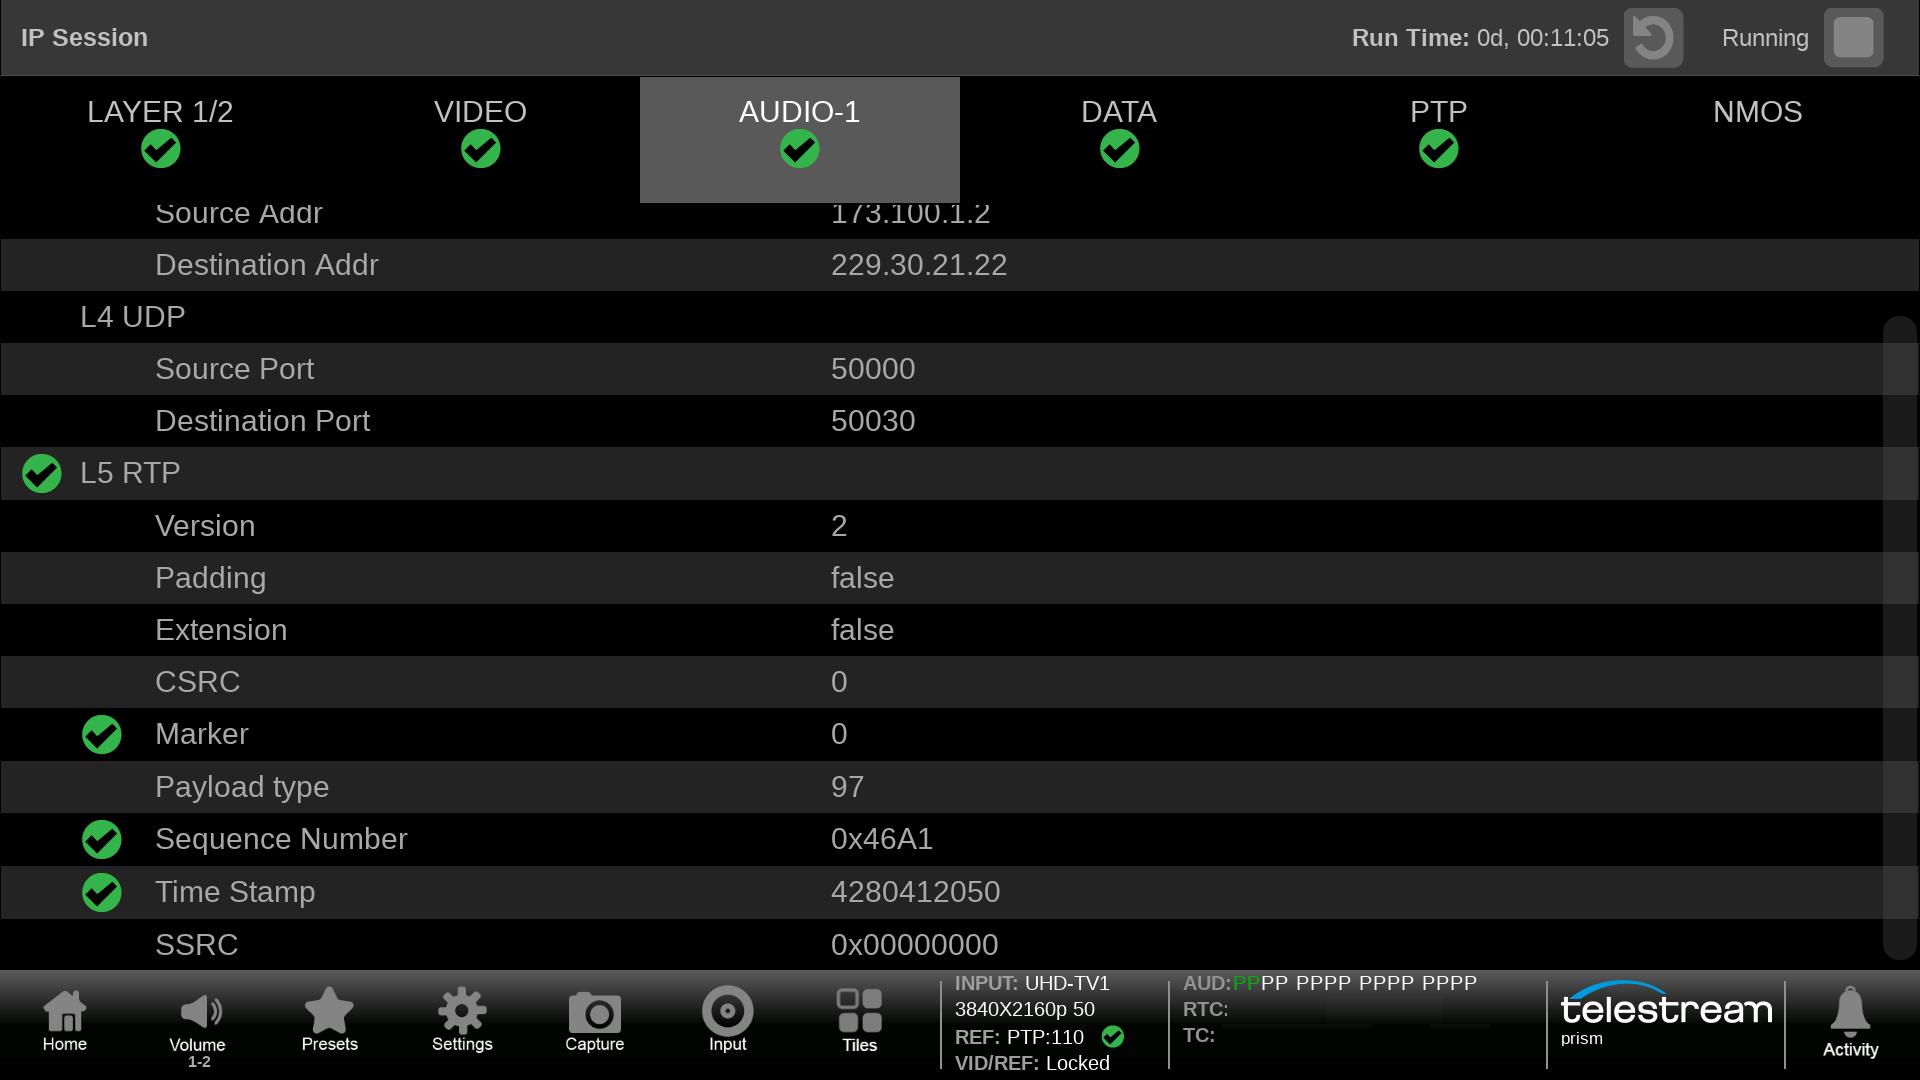
The Audio tab shows shows IP address, port number and RTP Layer 5 information such as Marker, Payload Type, Sequence Number and Timestamp.
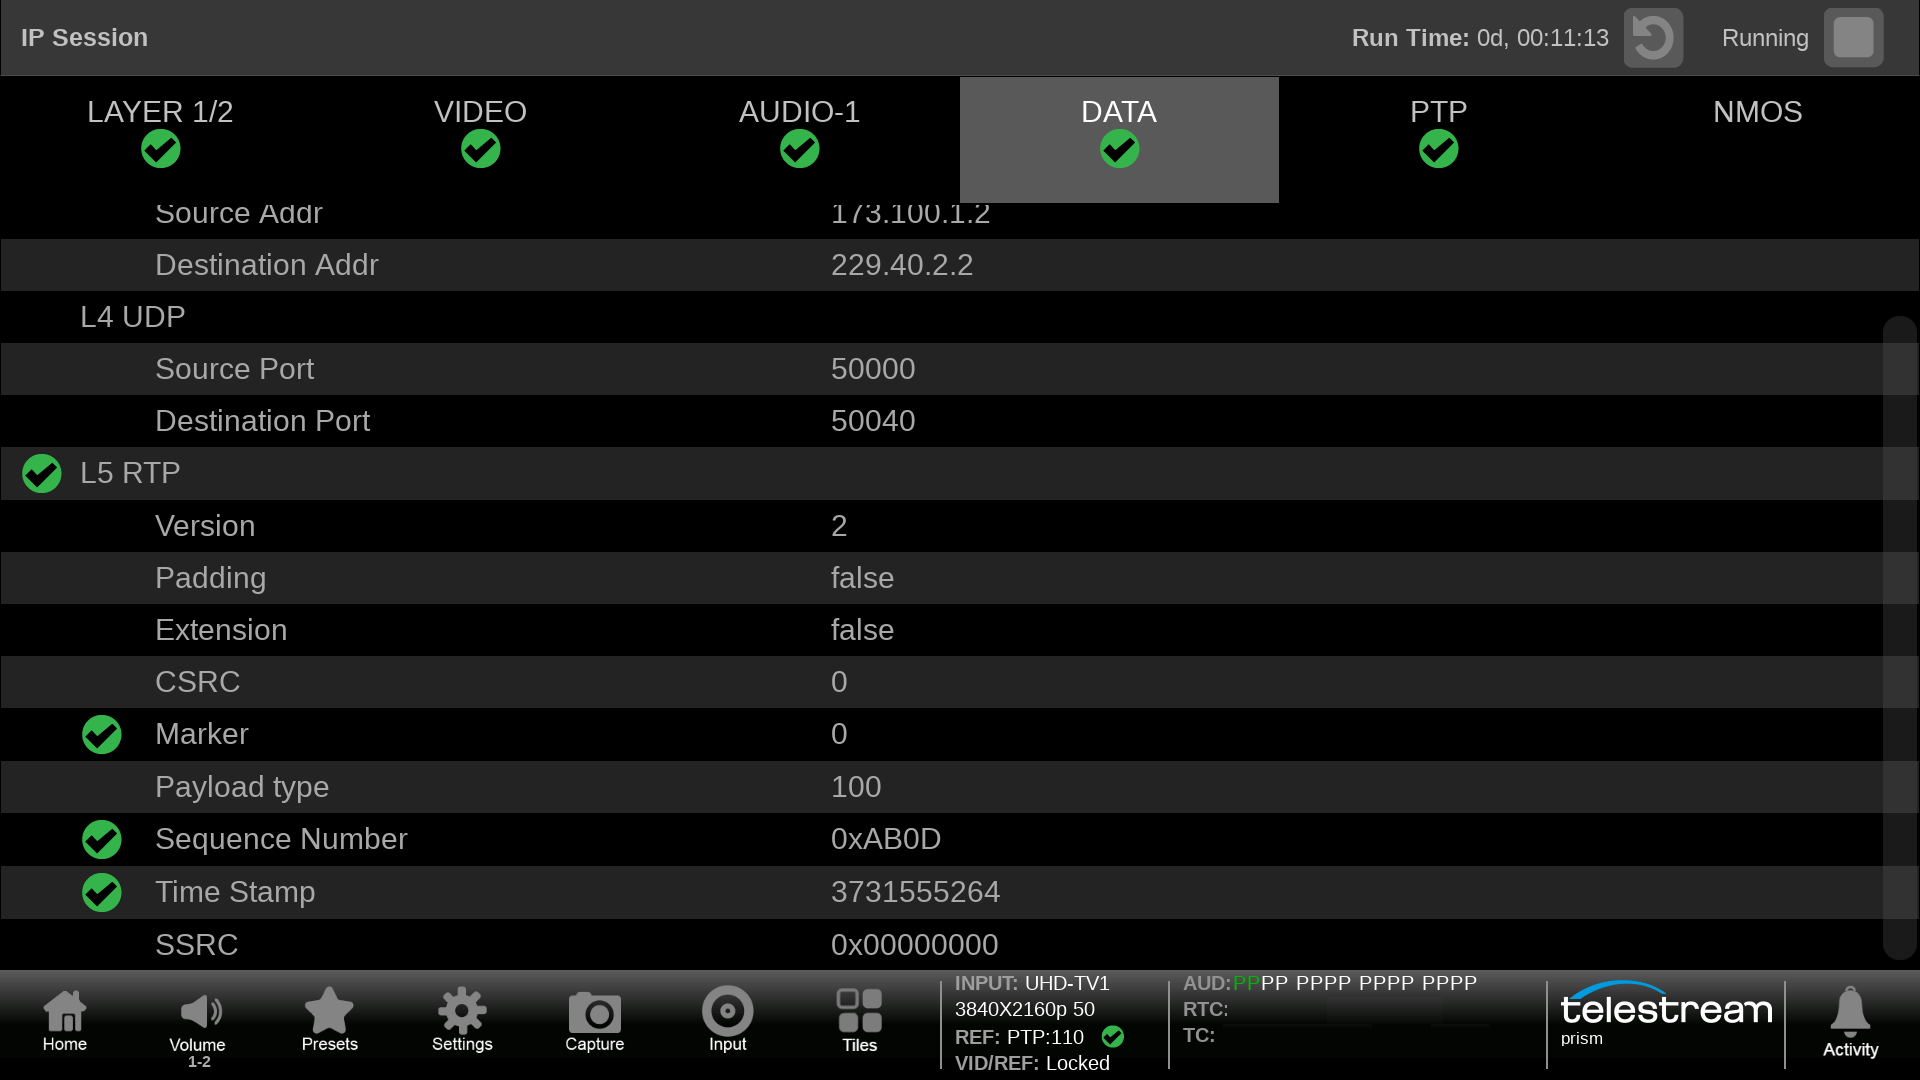
The Data tab shows shows IP address, port number and RTP Layer 5 information such as Marker, Payload Type, Sequence Number and Timestamp.
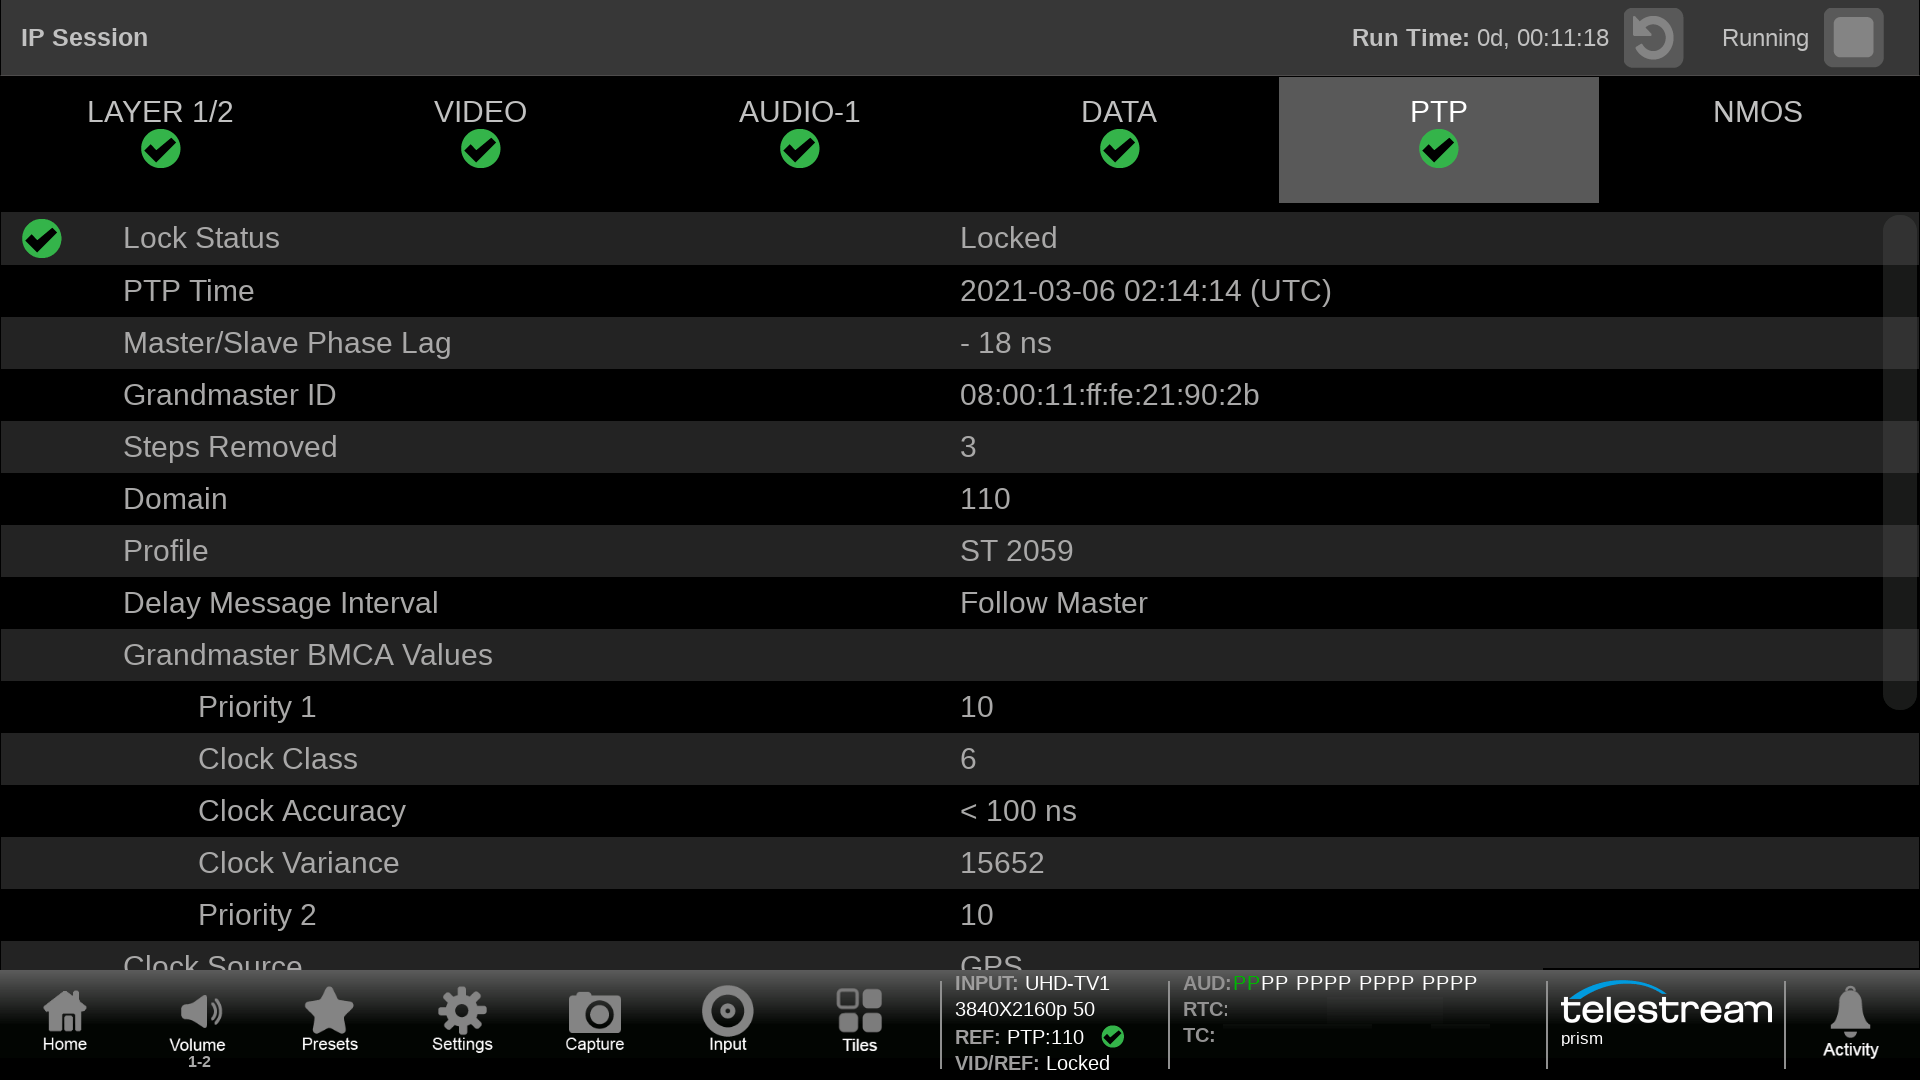
This display provides PTP syntax information including Grandmaster ID, Domain, Clock Class/ Accuracy/Variance. Priority 1 & 2 values along with message rates.
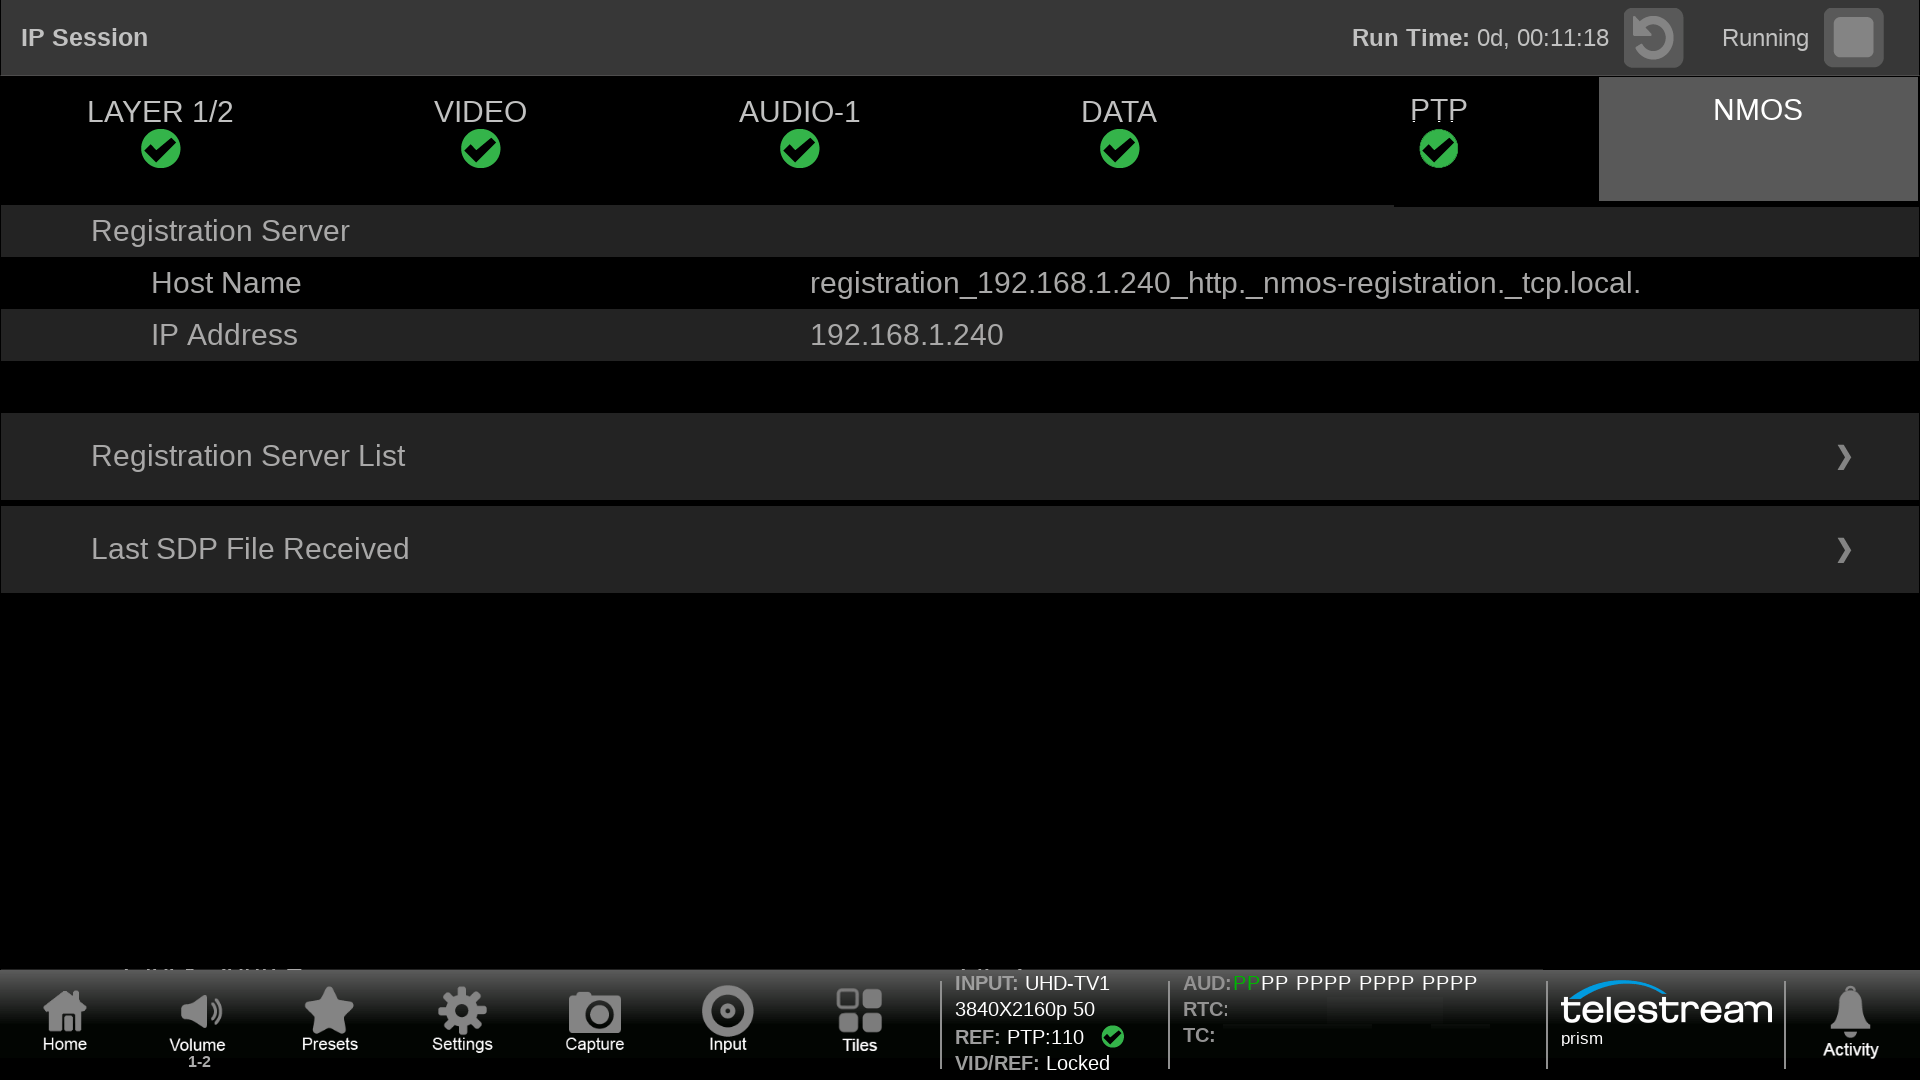
NMOS information is displayed showing NMOS server address and last SDP file sent.
PIT Histogram
Packet Interval Time Histogram shows a distribution of how the packets have arrived at the input to PRISM. Certain types of senders will have a characteristic distribution of the packets that can be helpful in diagnosing issues with streams. Requires option IP-MEAS to be installed in the instrument.
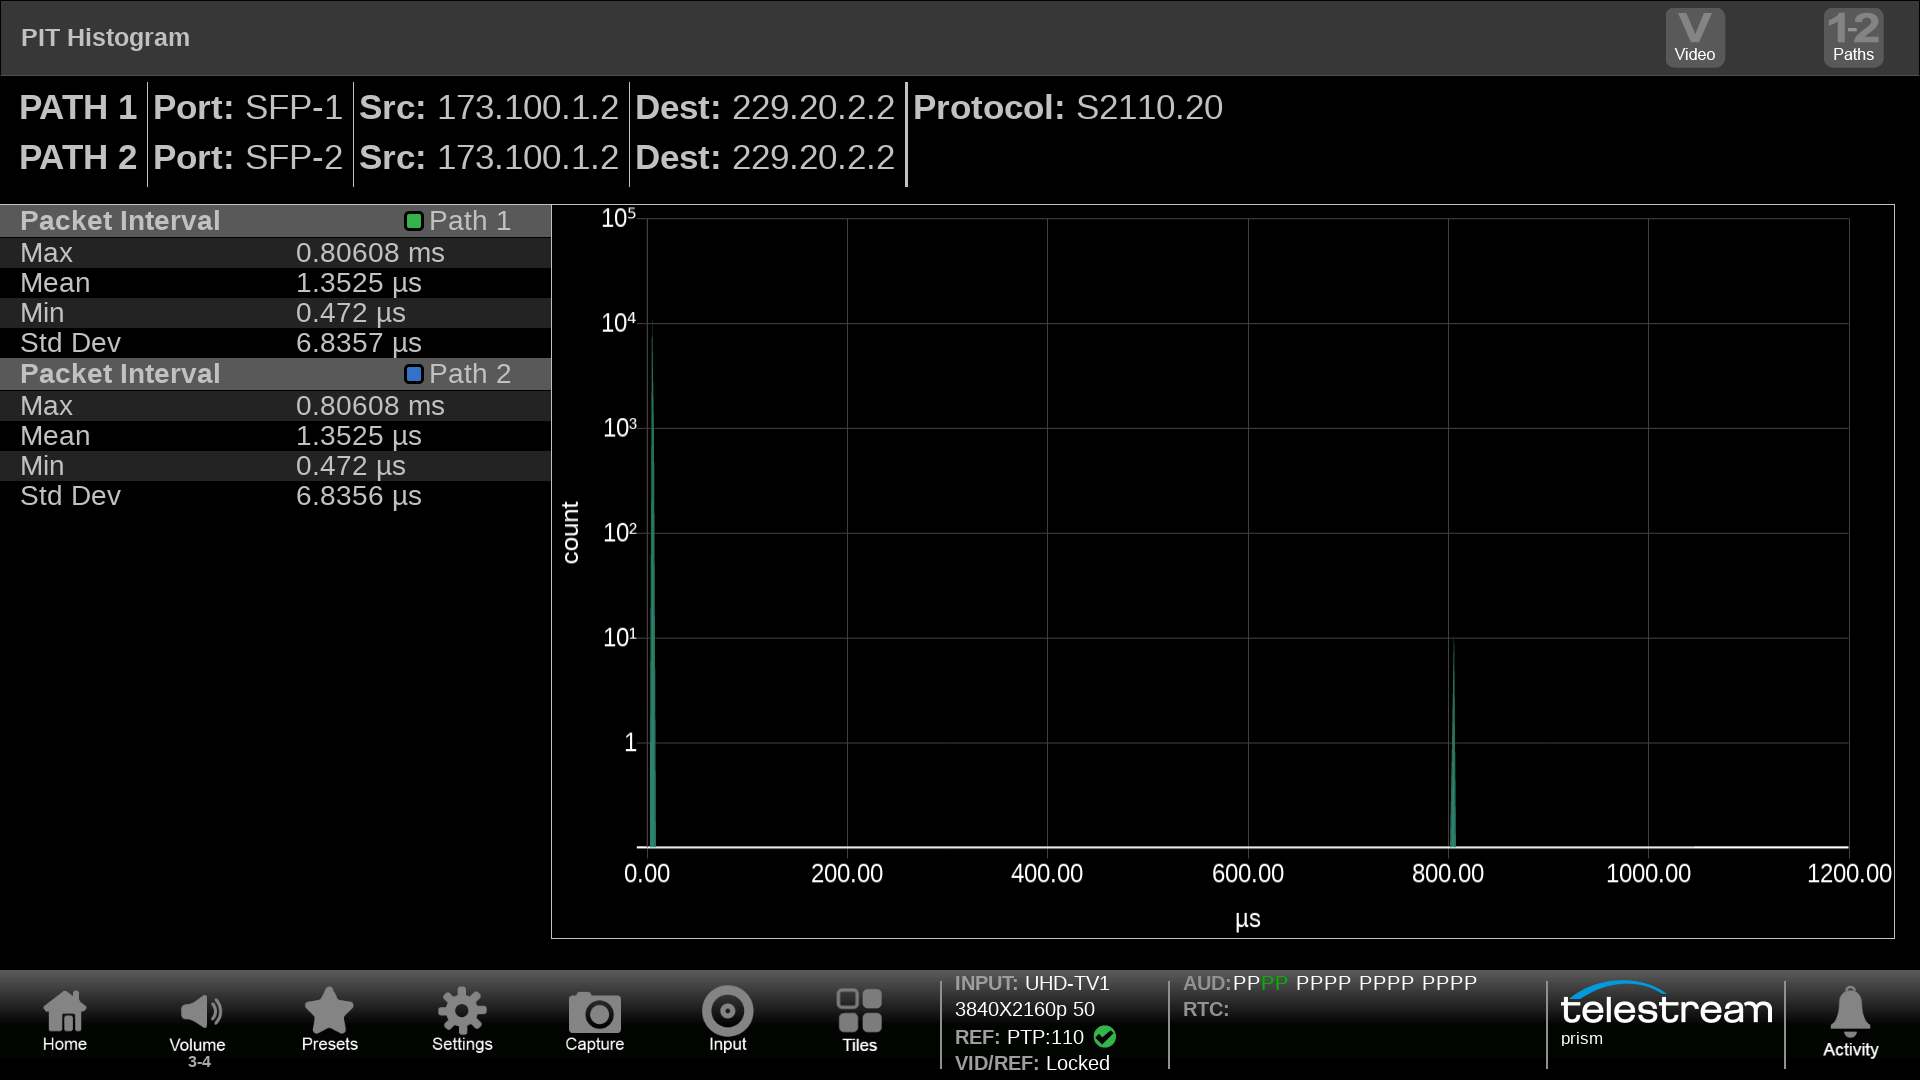
The PIT Histogram can be configured to show Video, Audio or Data streams for ST 2110. Here a characteristic PIT Histogram of a ST 2110-20 Gapped sender is shown for Path 1-2.
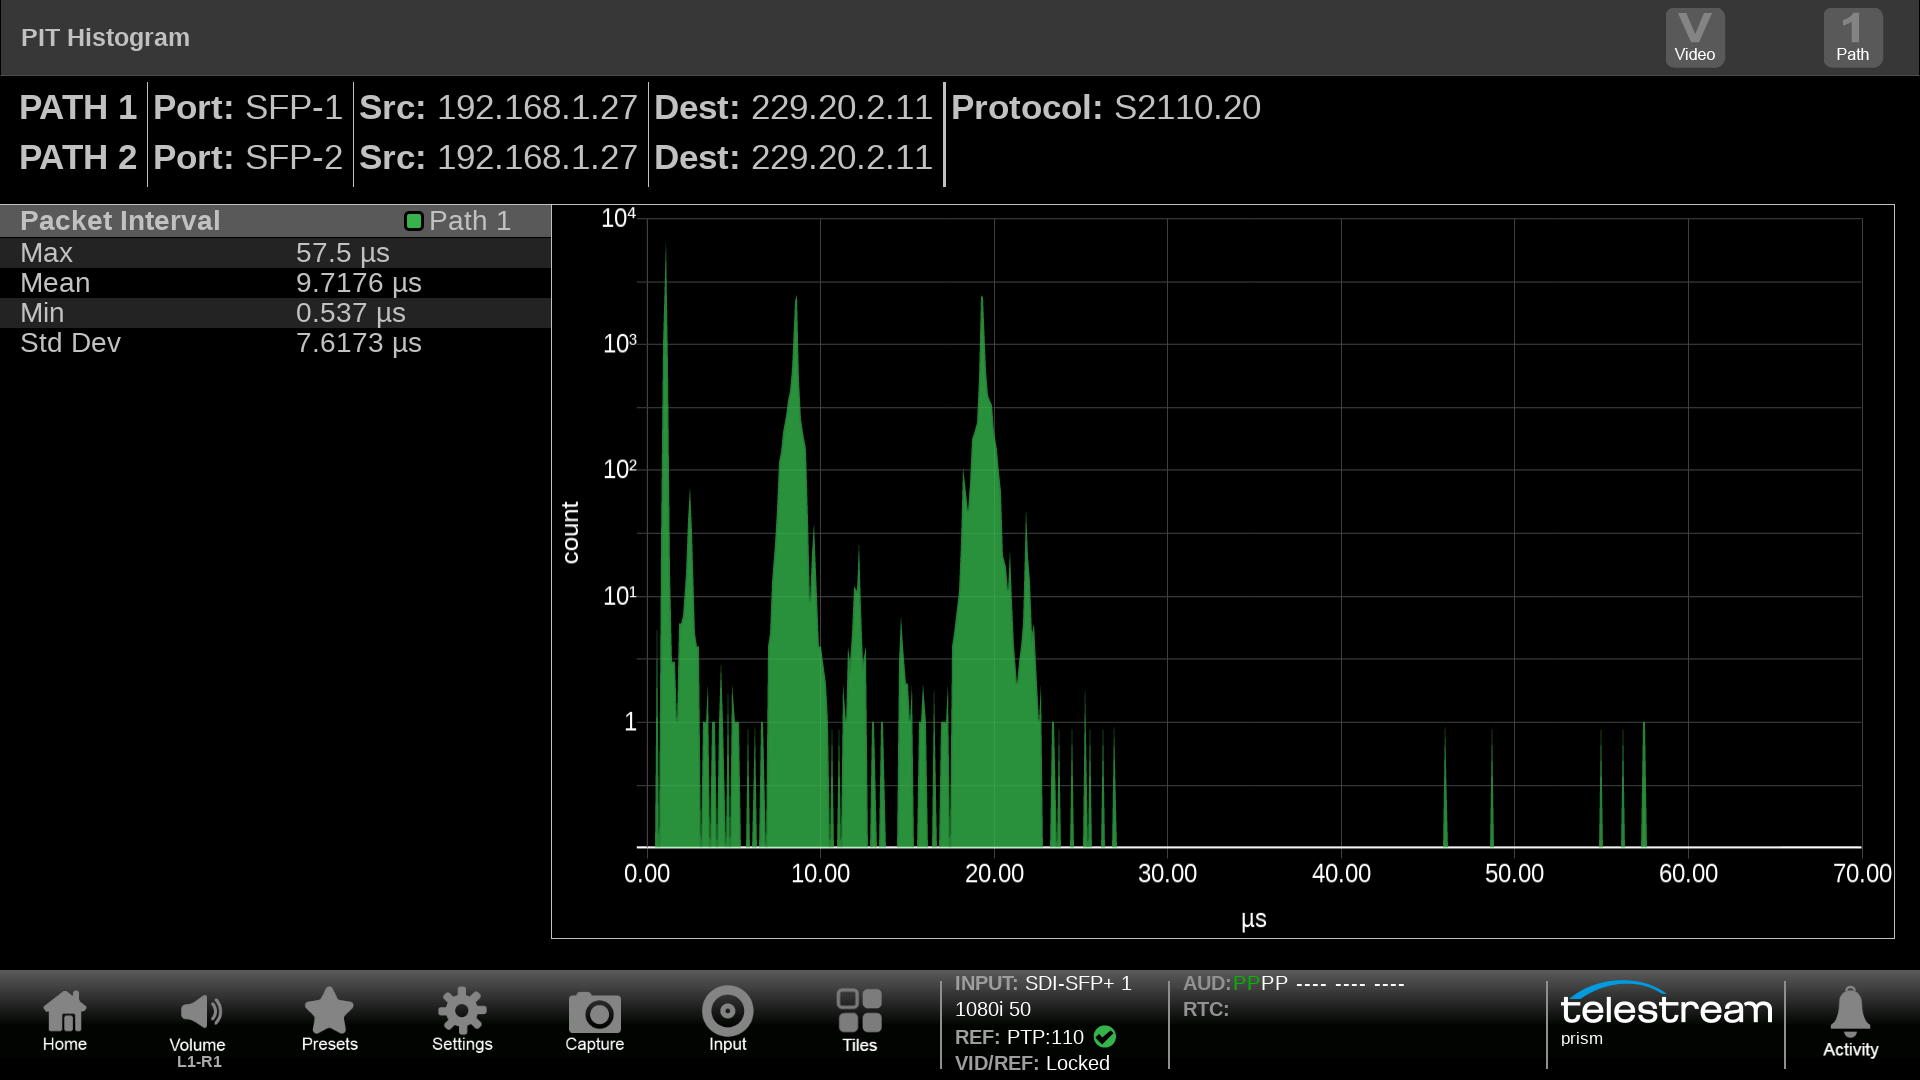
This PIT Histogram shows the characteristics of a Linear Wide Sender that has wide distribution of packets shown by the Min and Max values.
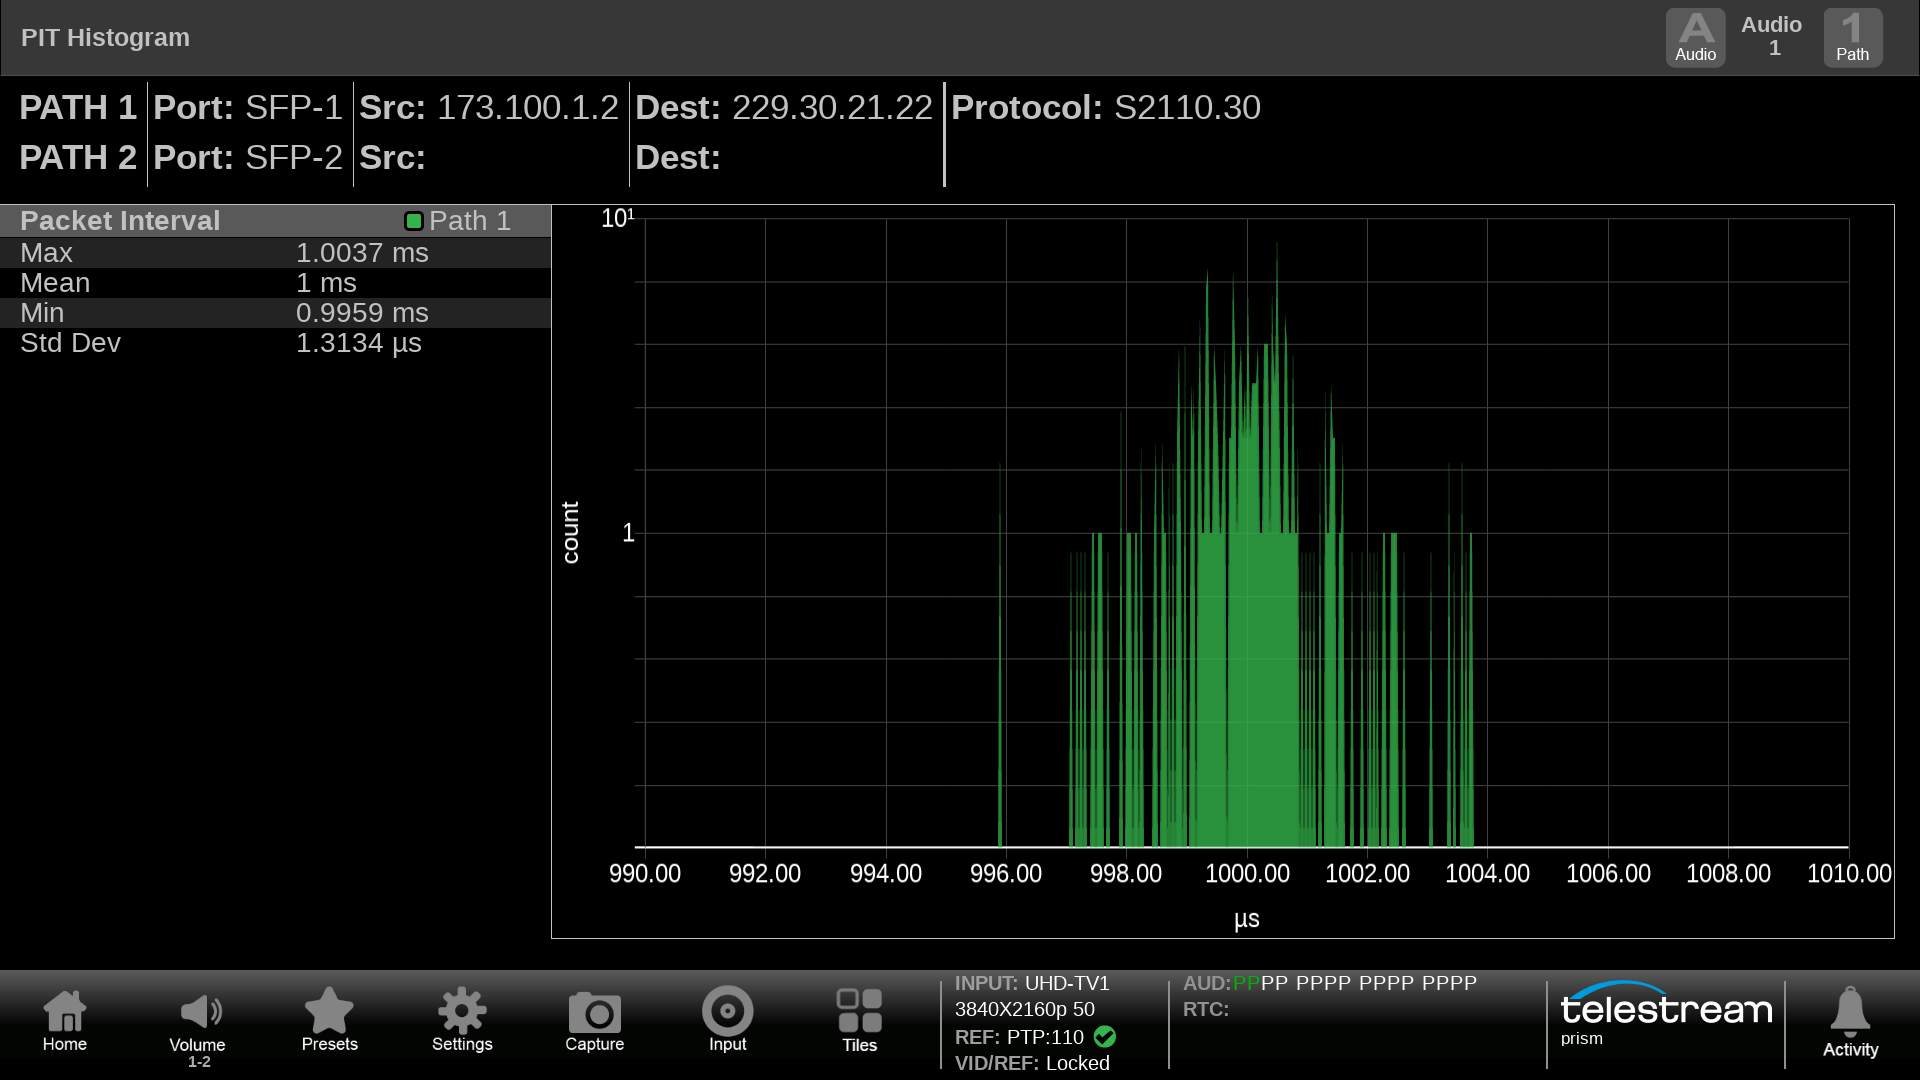
This image shows the PIT Histogram of an Audio Sender being received by PRISM. In this case the Mean packet distribution is 1ms giving an indication of the type of audio being sent.
IP Graphs
IP Graphs allows for metrics of the IP stream to be plotted from 60 seconds to 24 hours. This allows the user to track the health of the stream over time and identify possible errors with the signal. IP graphs provide information on Total Bitrate, Session Bitrate, PIT, RTP Sequence Error and other graphs dependent on the type of stream being decoded. Requires option IP-MEAS to be installed in the instrument.

The Total and Session Bit Rate provide indication of the Total bit rate of streams present on the SFP ports of Prism and indicates the decode streams bit rate that can be monitored for up to 24 hours.
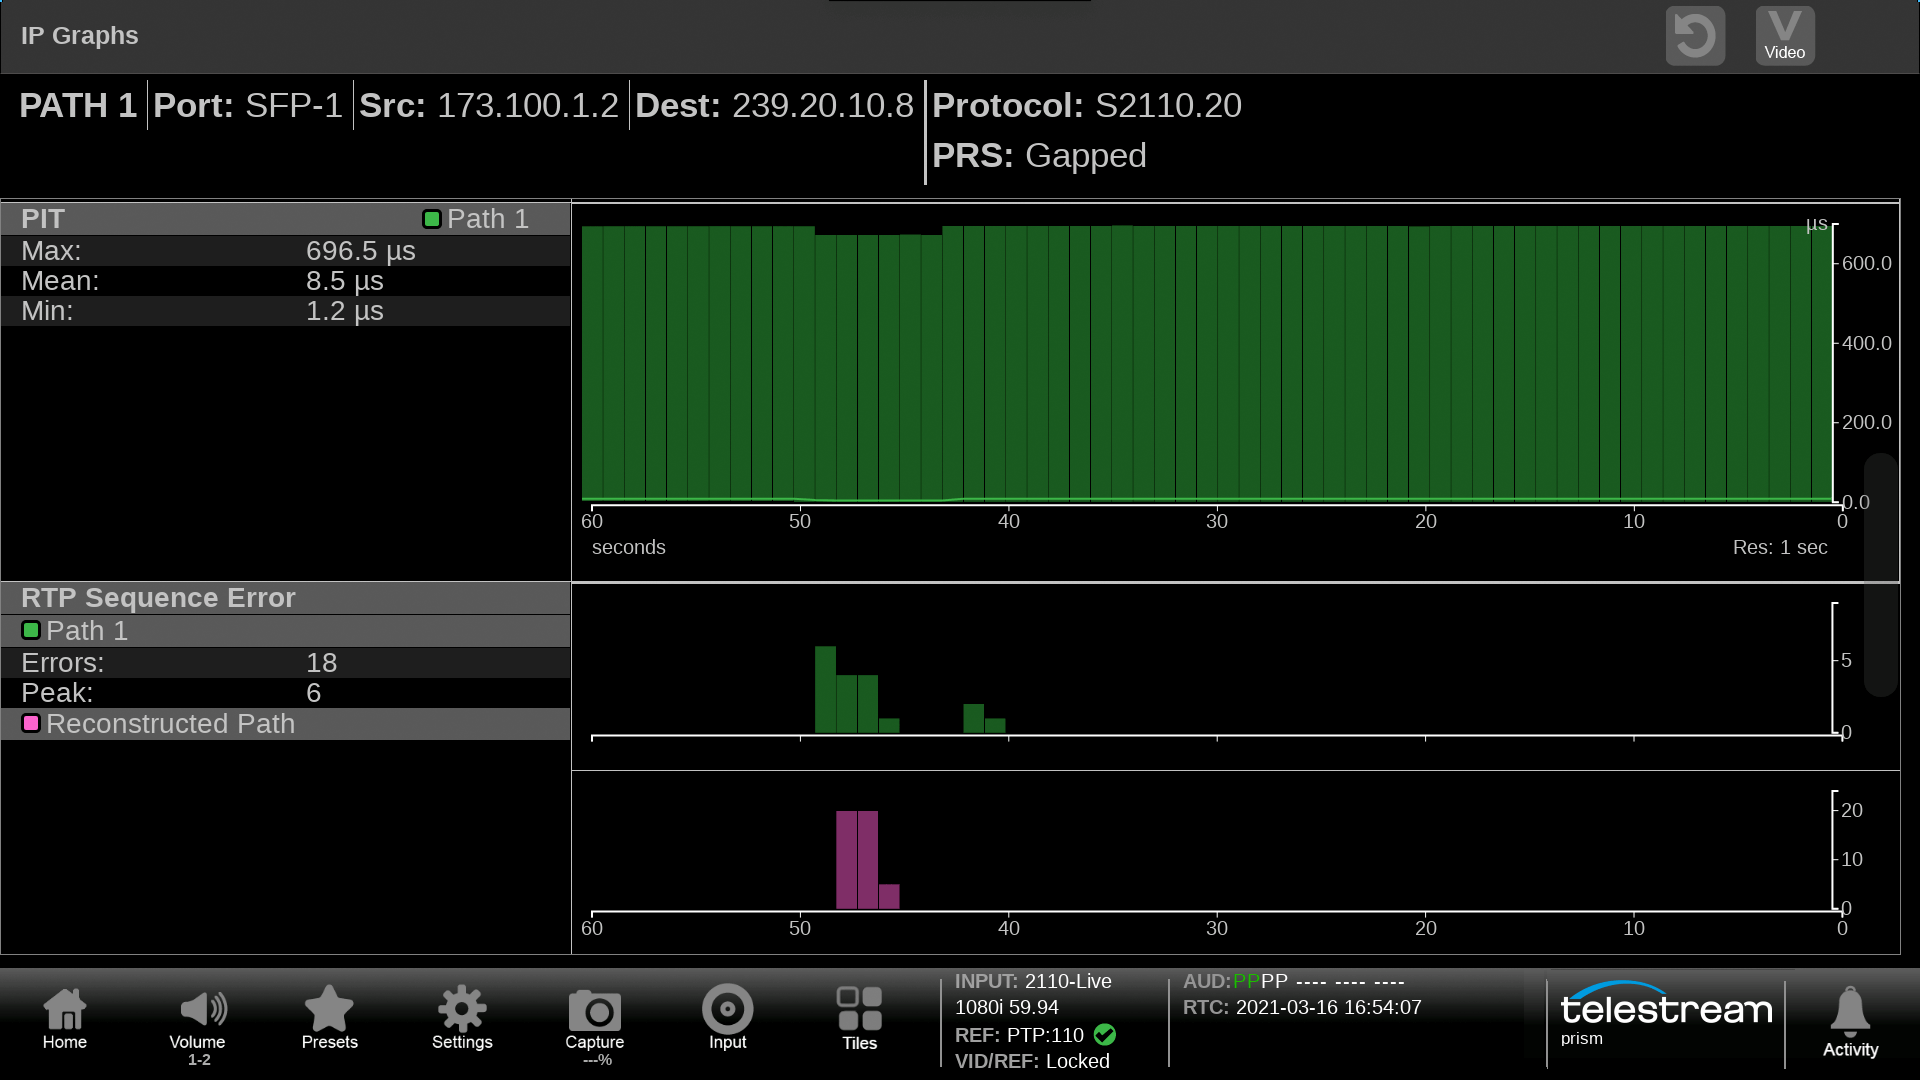
The PIT graphs plots the Packet Interval Time and can show variations within the network. The RTP Sequence Errors shows packet that arrive out of order and whether they can be corrected by the buffer within PRISM.
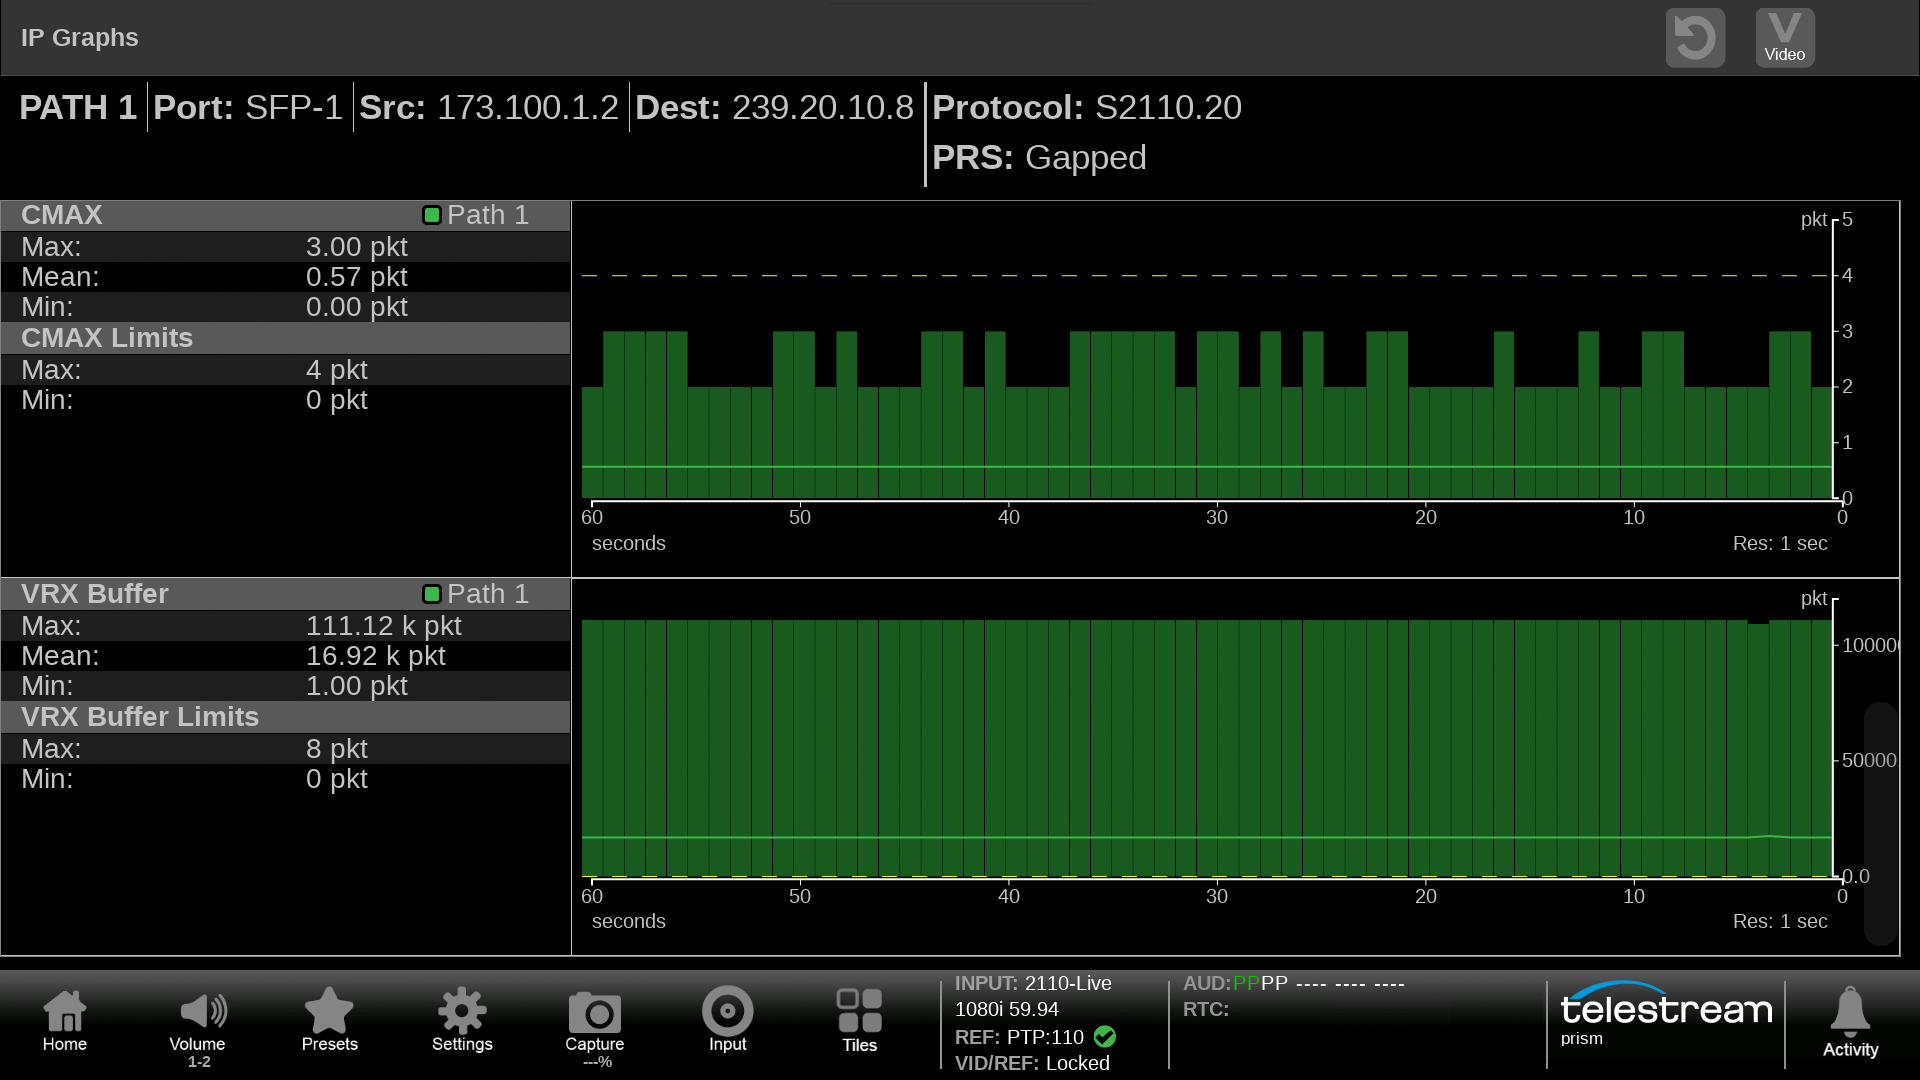
For ST 2110-20 video streams CMAX and VRX Buffer can be plotted over time as specified in ST 2110-21.
Stream Timing
Stream Timing can be used to track the timing of the input signal to the PTP reference to ensure that the Sender of the stream is locked to PTP and to track the variations across the network of the stream by PRISM for video, audio and data. Requires option IP-MEAS to be installed in the instrument.
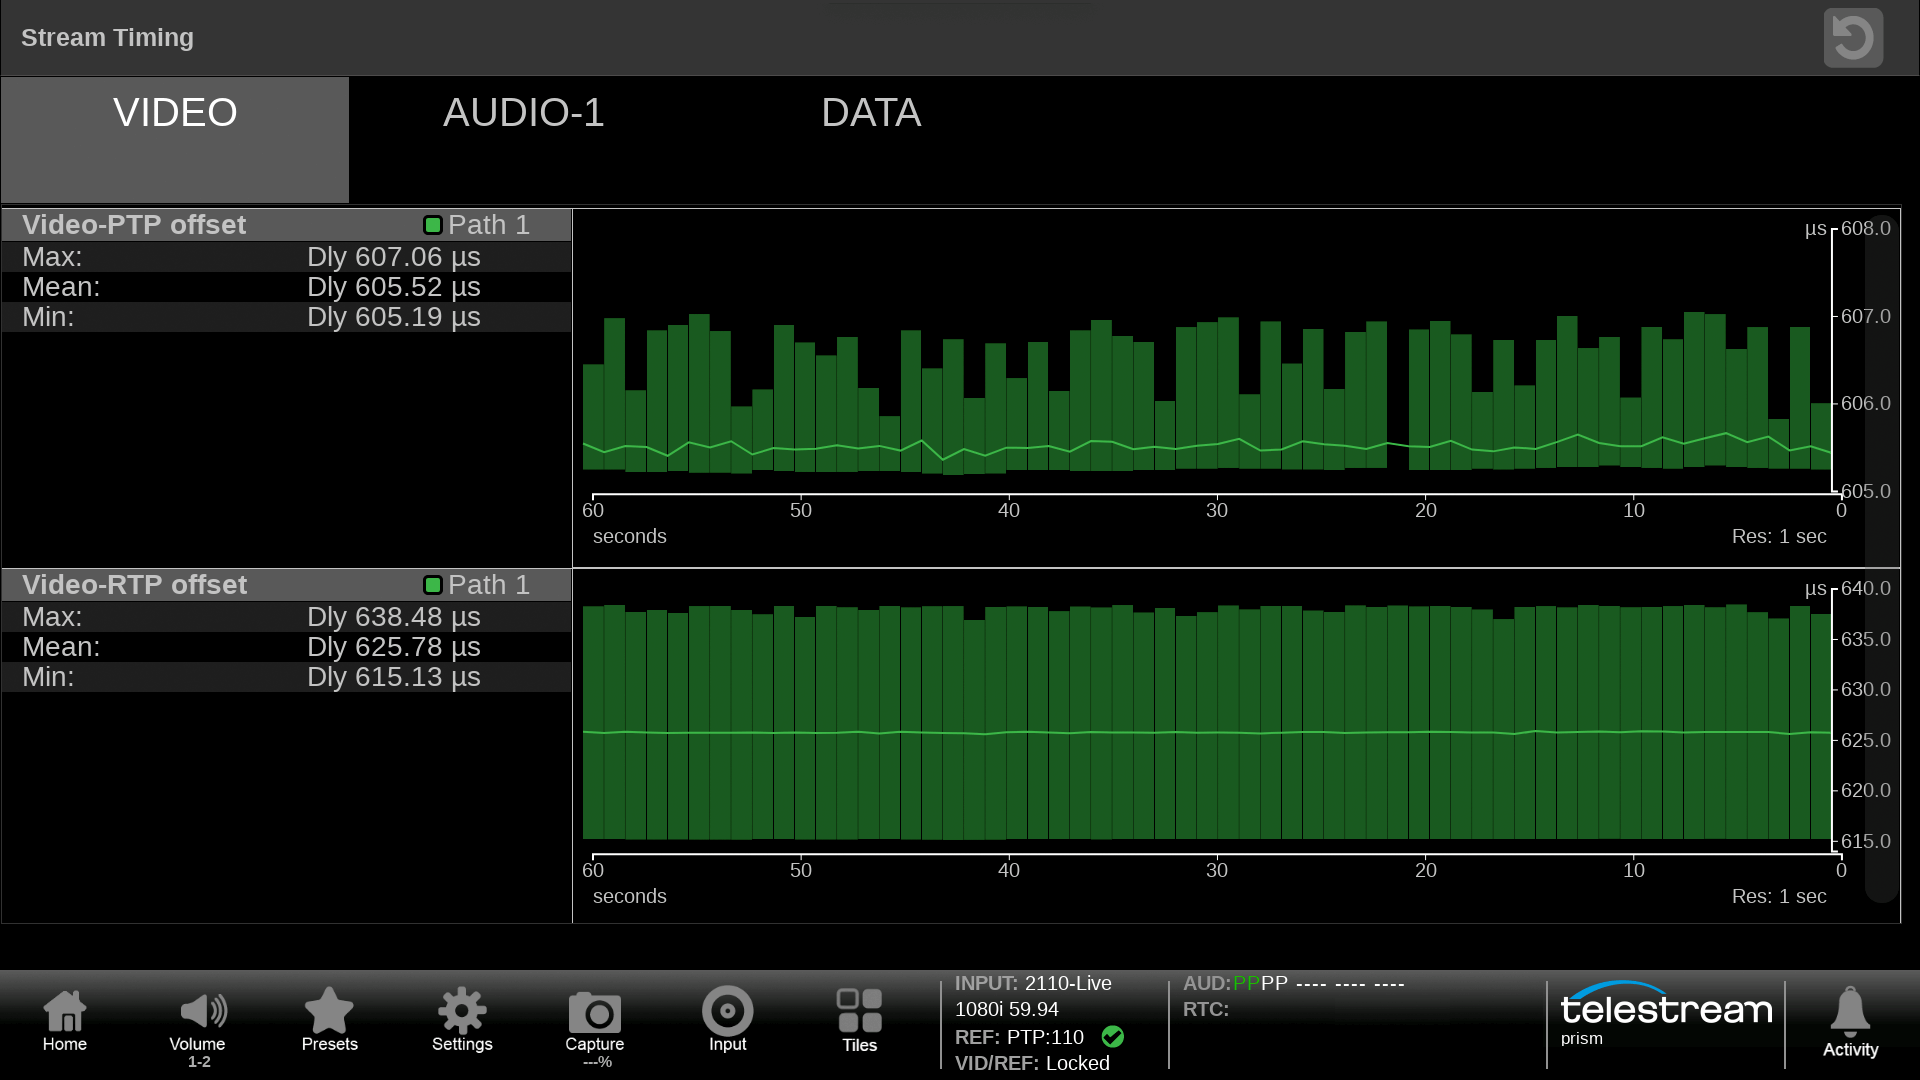
The Video tab shows the Video-PTP offset which is a graphical plot of the Timing displays variation. The Video-RTP offset shows timing of the received signal relative to the embedded RTP time stamp.
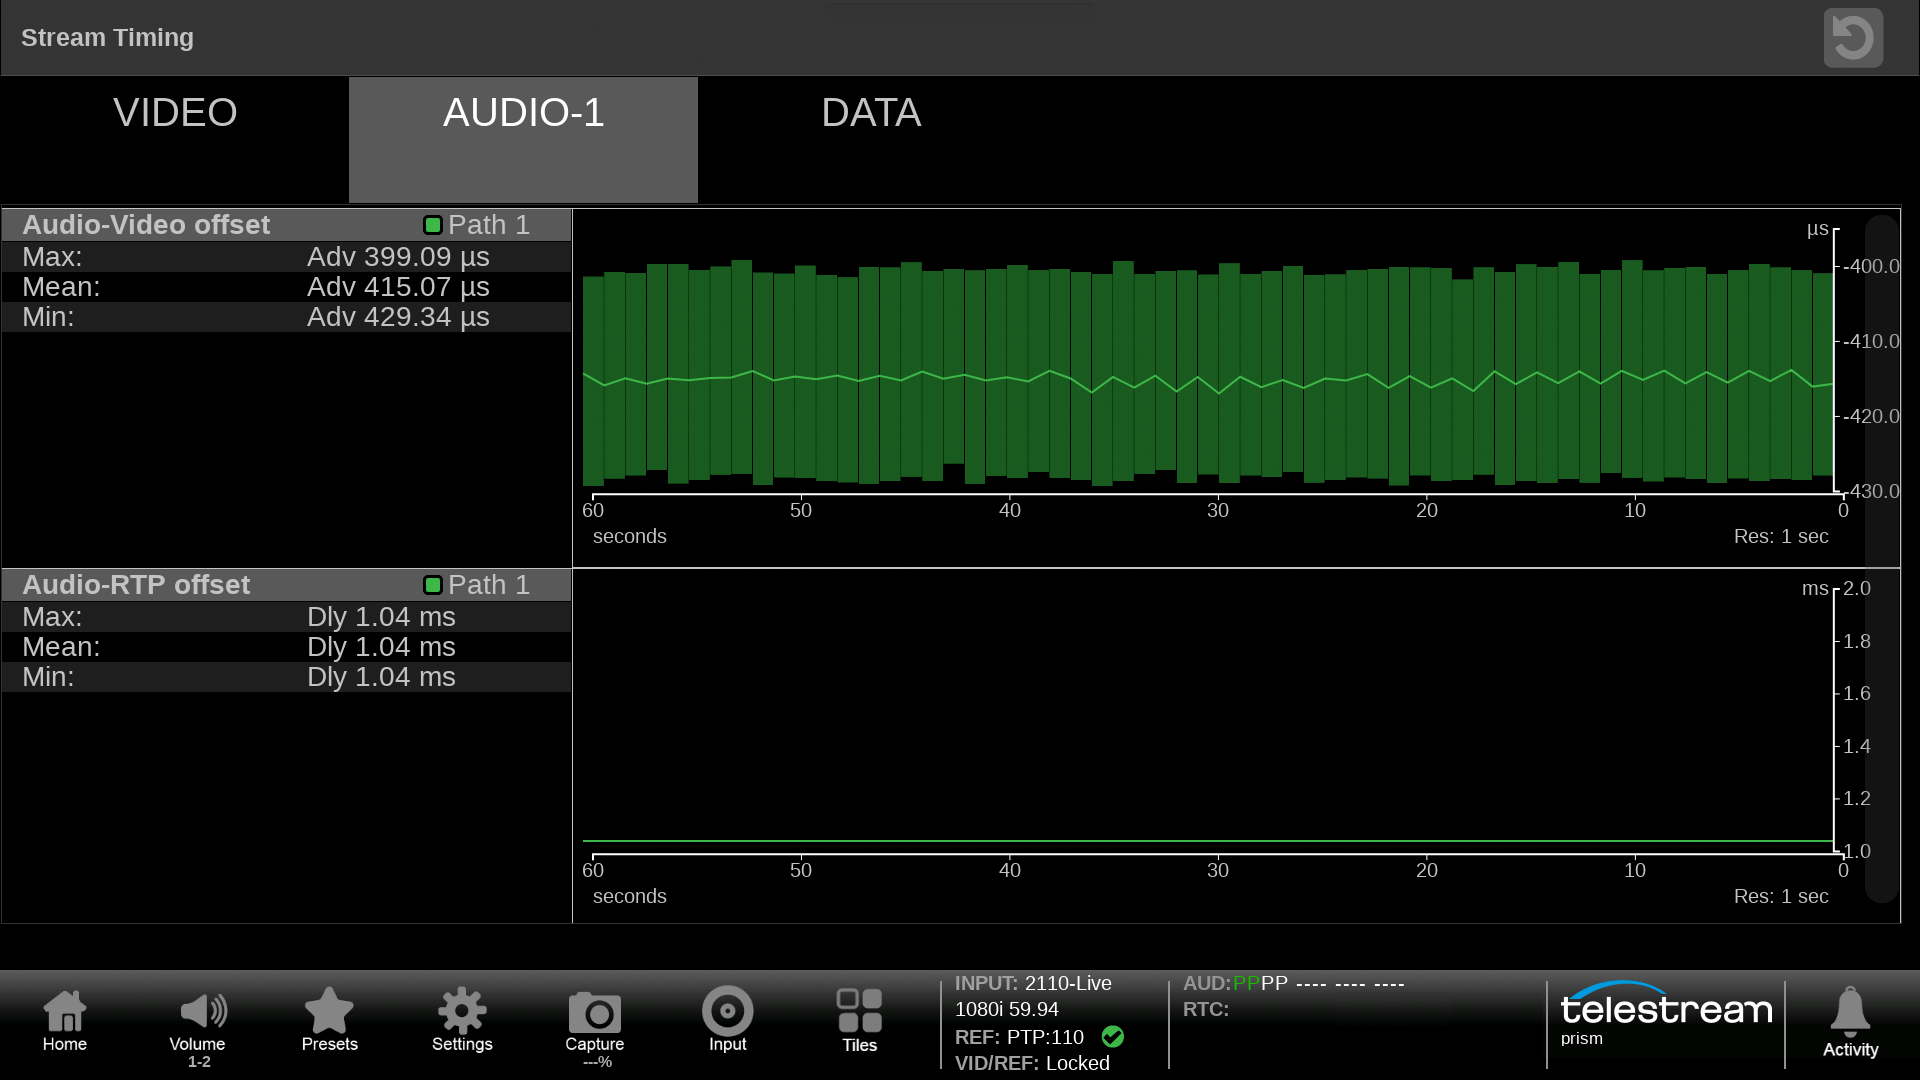
The Audio tab shows the Aud-Video offset that can indicate the amount of delay that must be applied to realign the signals. The Aud-RTP offset shows the timing of the audio stream relative to the embedded RTP time stamps.
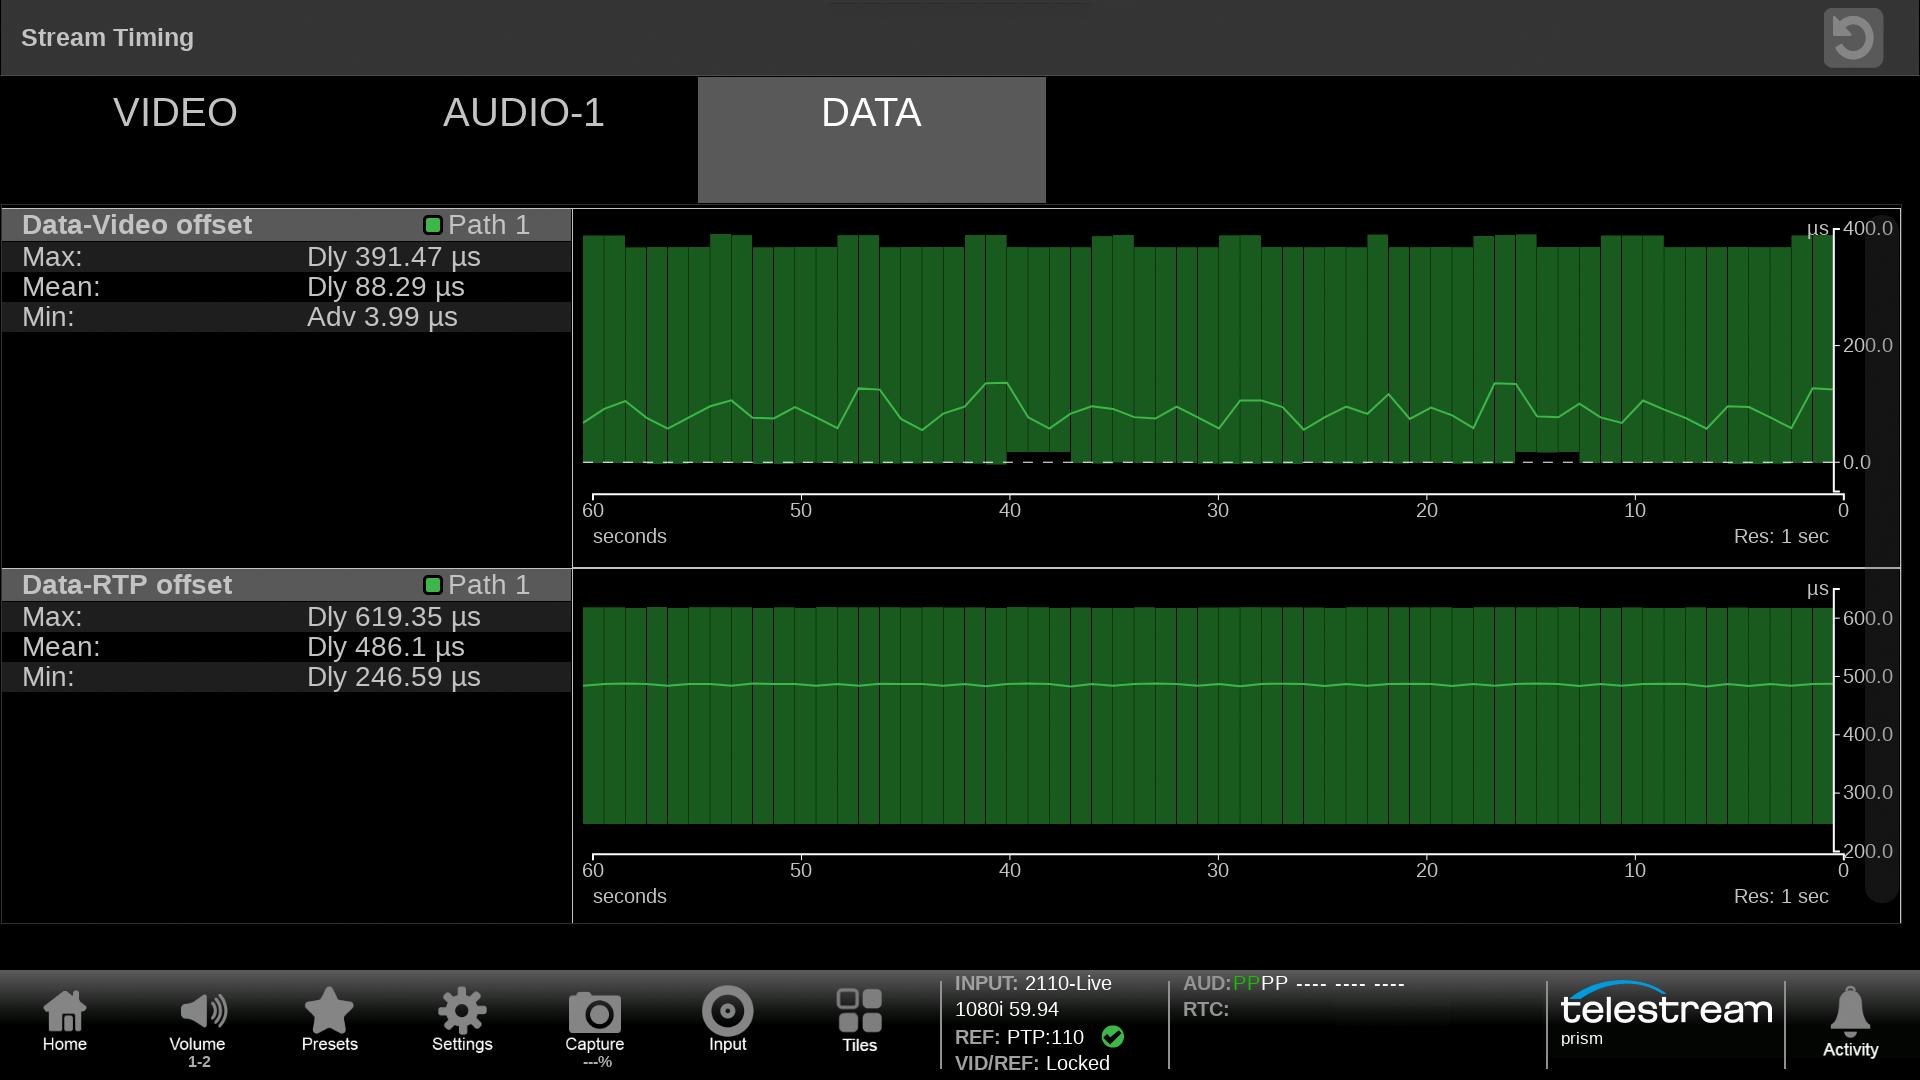
The Data tab shows the Data-Vid offset indicating the relative delay between the data and video stream. In order to realign the signals the delay amount should be applied.
PTP Graphs
PTP Graphs provide a plot of the forward and reverse paths of the PTP messages across the network. The user can select a window between 60 seconds to twenty four hours to monitor the variations over time. Requires option IP-MEAS to be installed in the instrument.
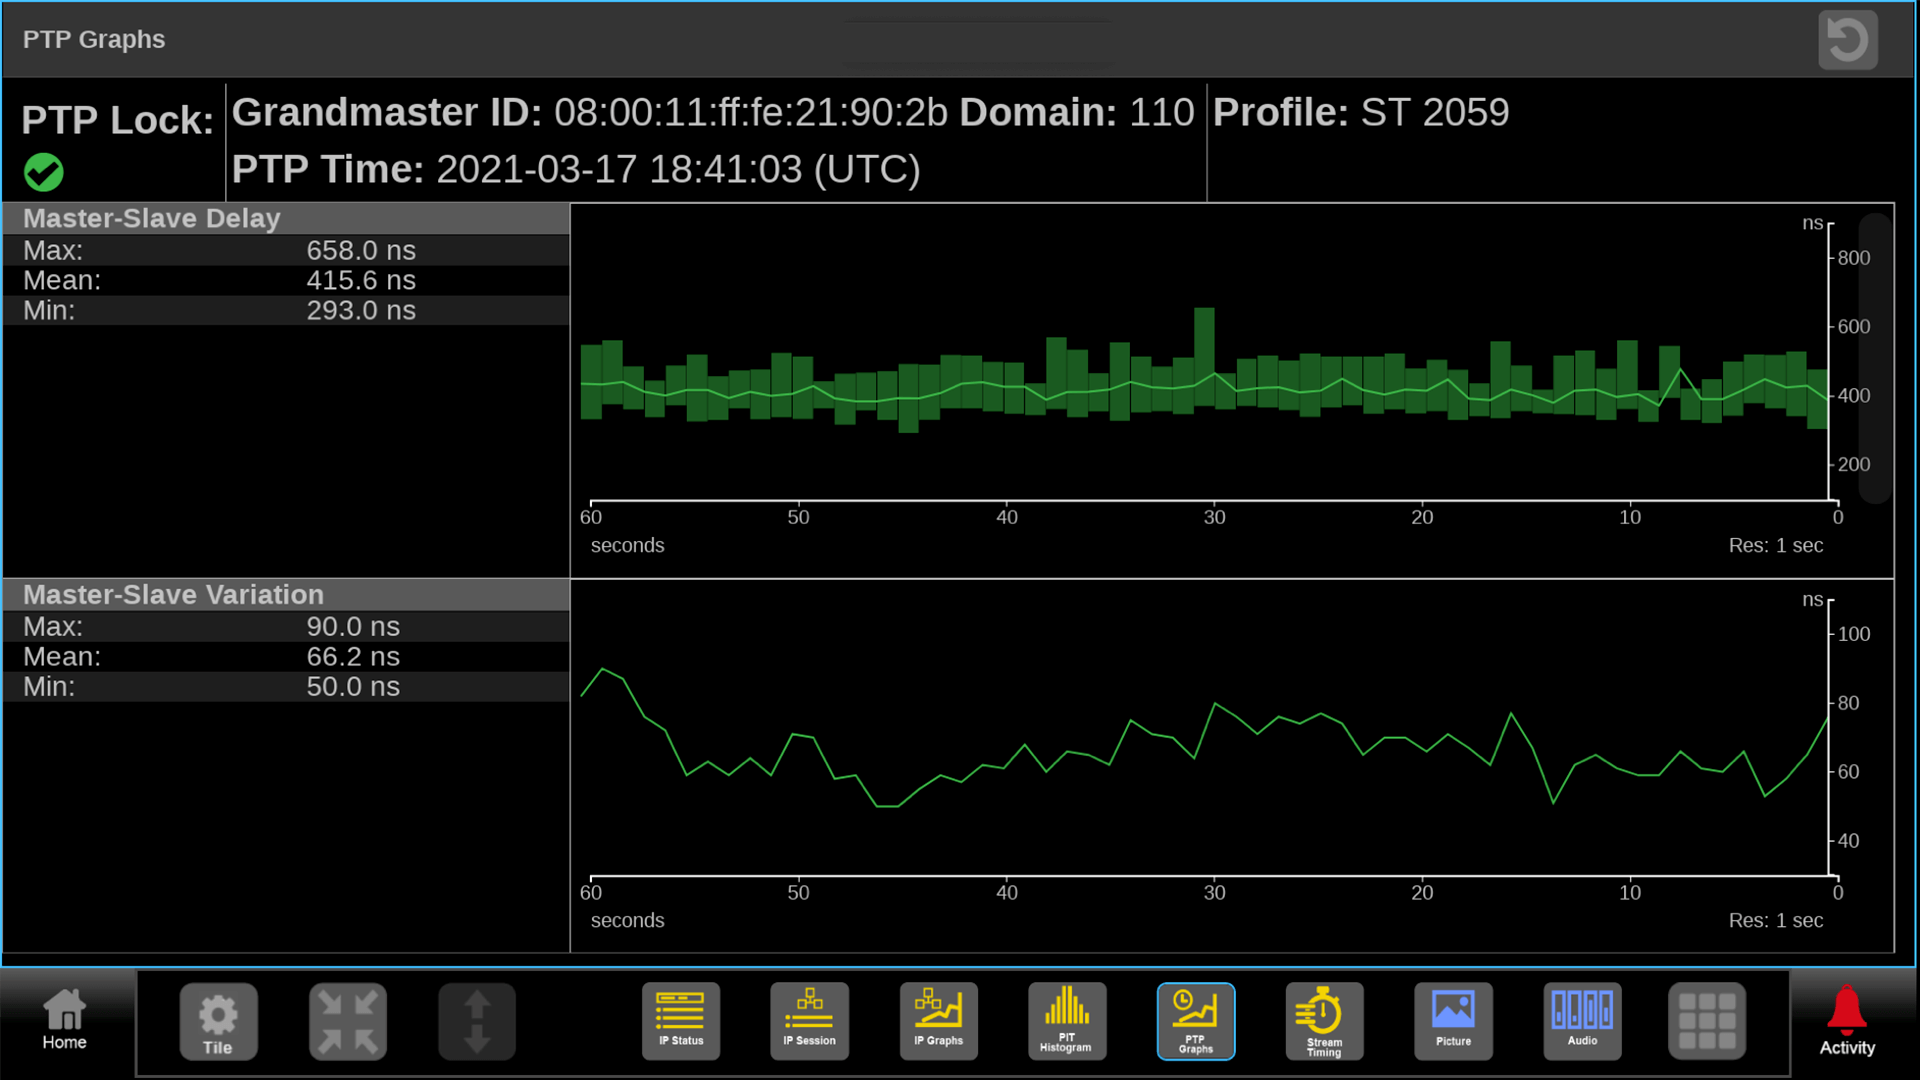
The PTP Graphs shows that PTP is locked on PRISM and shows the Grandmaster ID and the Domain being used. The Master to Slave graphs shows Delay and Variations plotted over the last 60 seconds of the forward path.
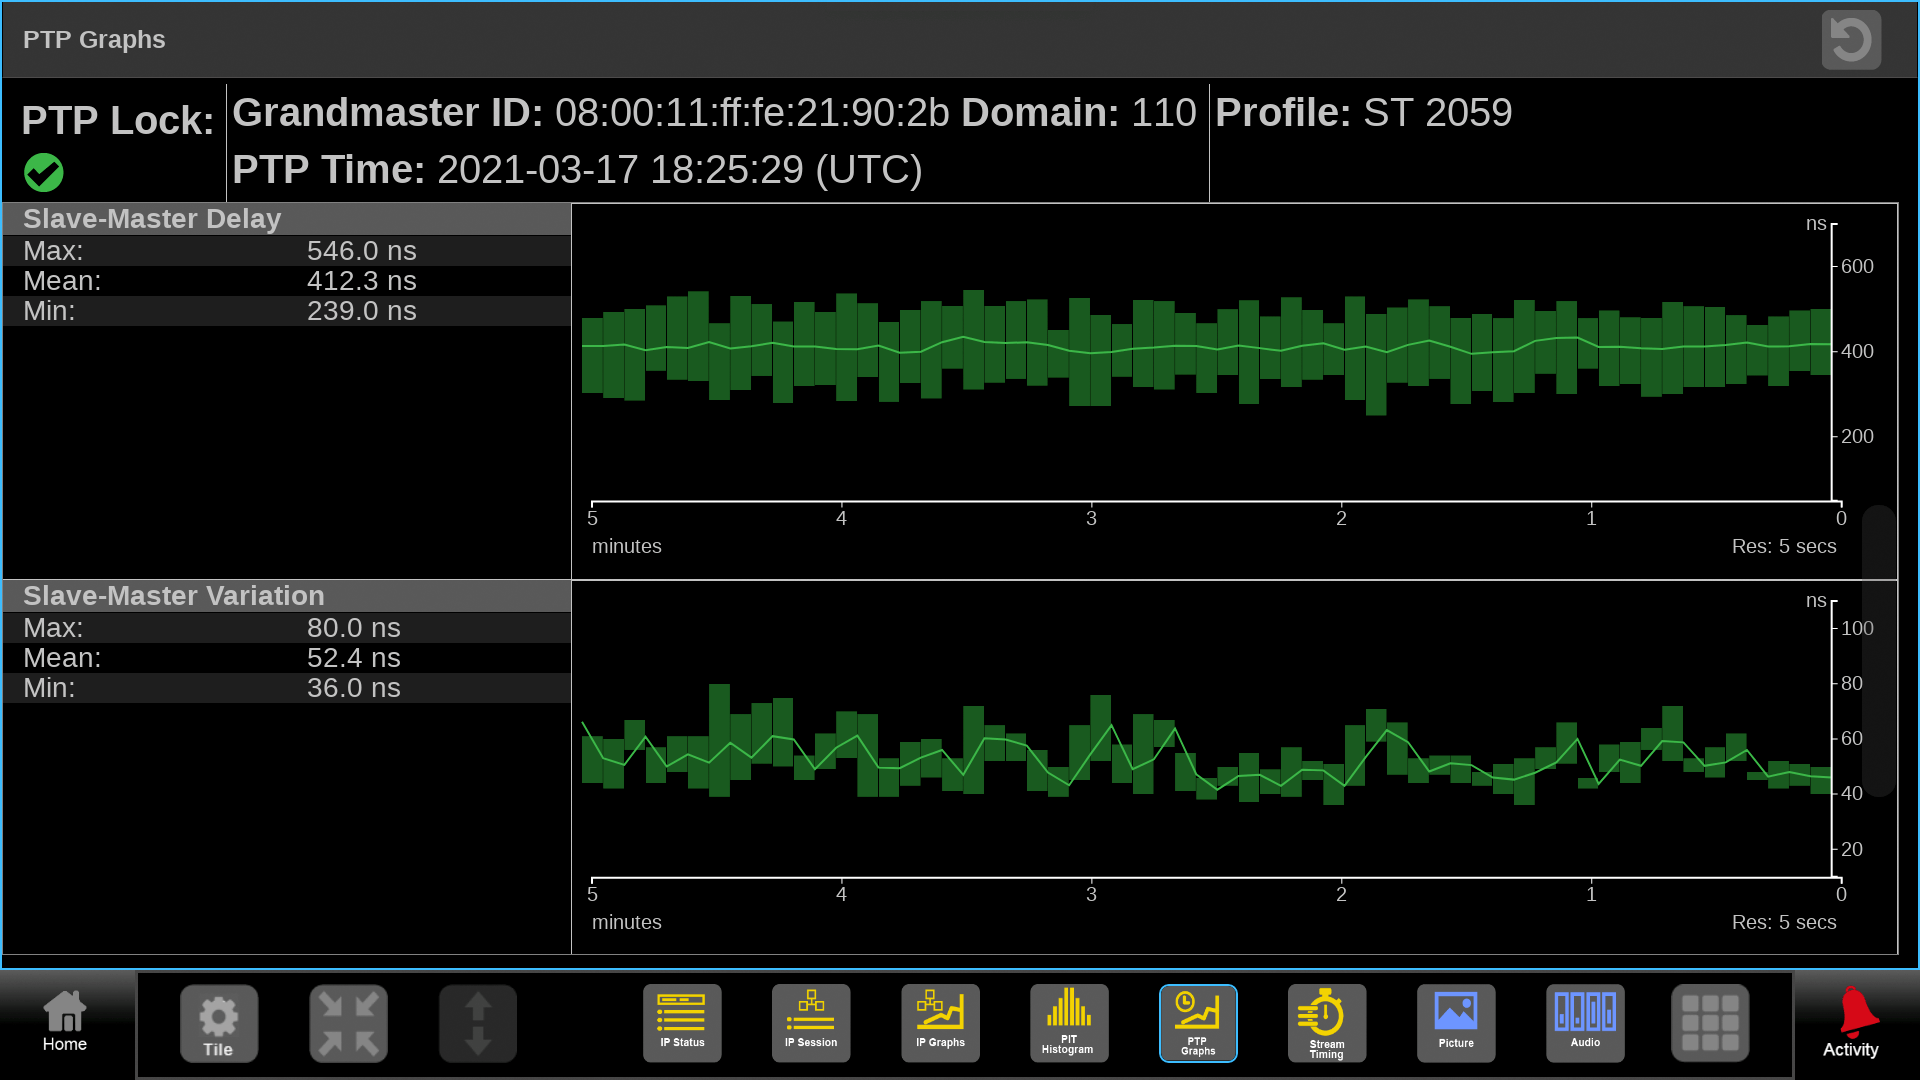
Slave-Master Delay and Variation show the reverse path of PTP messages. This graph was configured to plot over the last 5 minutes. This can be used to observe variation in network traffic that could delay PTP messages in the reverse path.
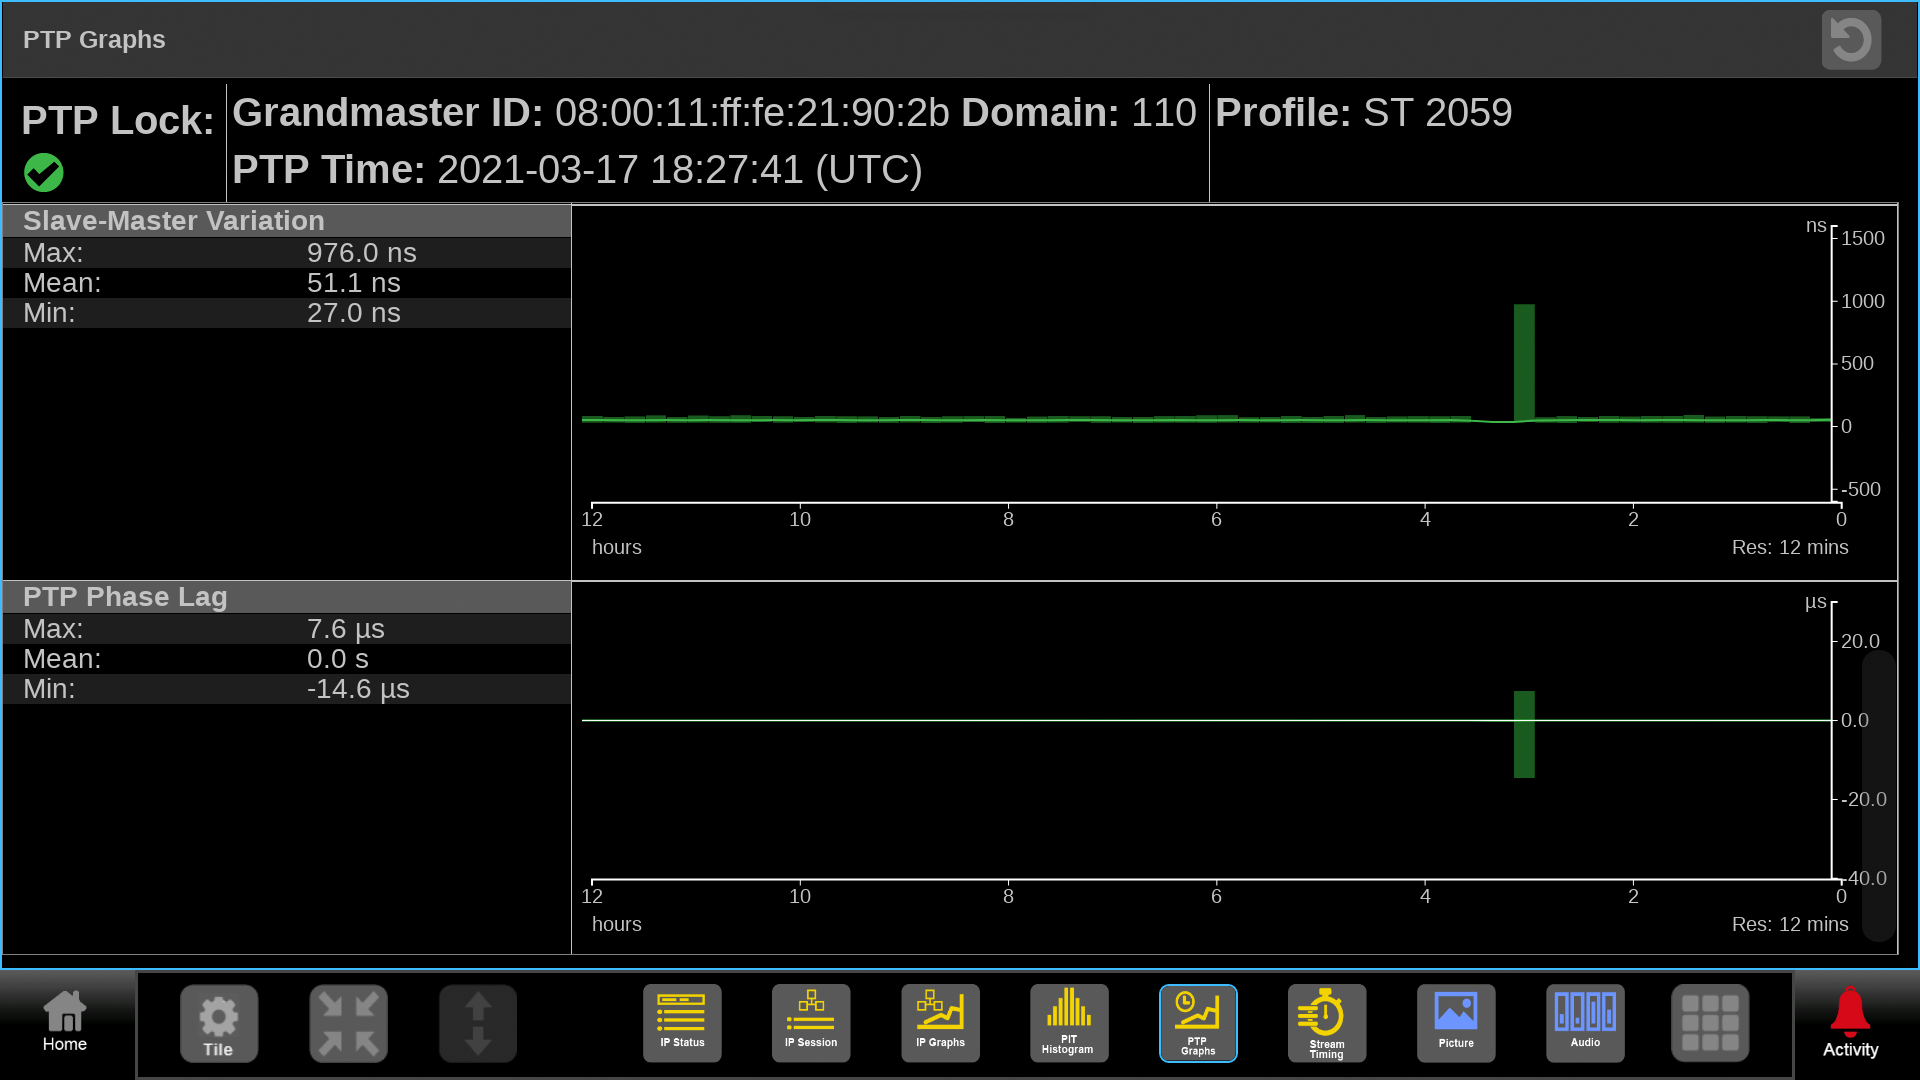
Phase Lag is the phase error of the phase-locked loop that controls the slave clock. This graphs was plotted over the last 12 hours and shows a disturbance about three hours ago.
CIE Display
The CIE display shows the video input plotted as a 1931 or 1976 CIE diagram. This display is used to check the chromaticity of the video signal and determine compliance to the standard color Gamut limits. With the Luma Qualified CIE enabled the user can define the luma range to be shown within CIE display. Requires option PROD to be installed in the instrument.
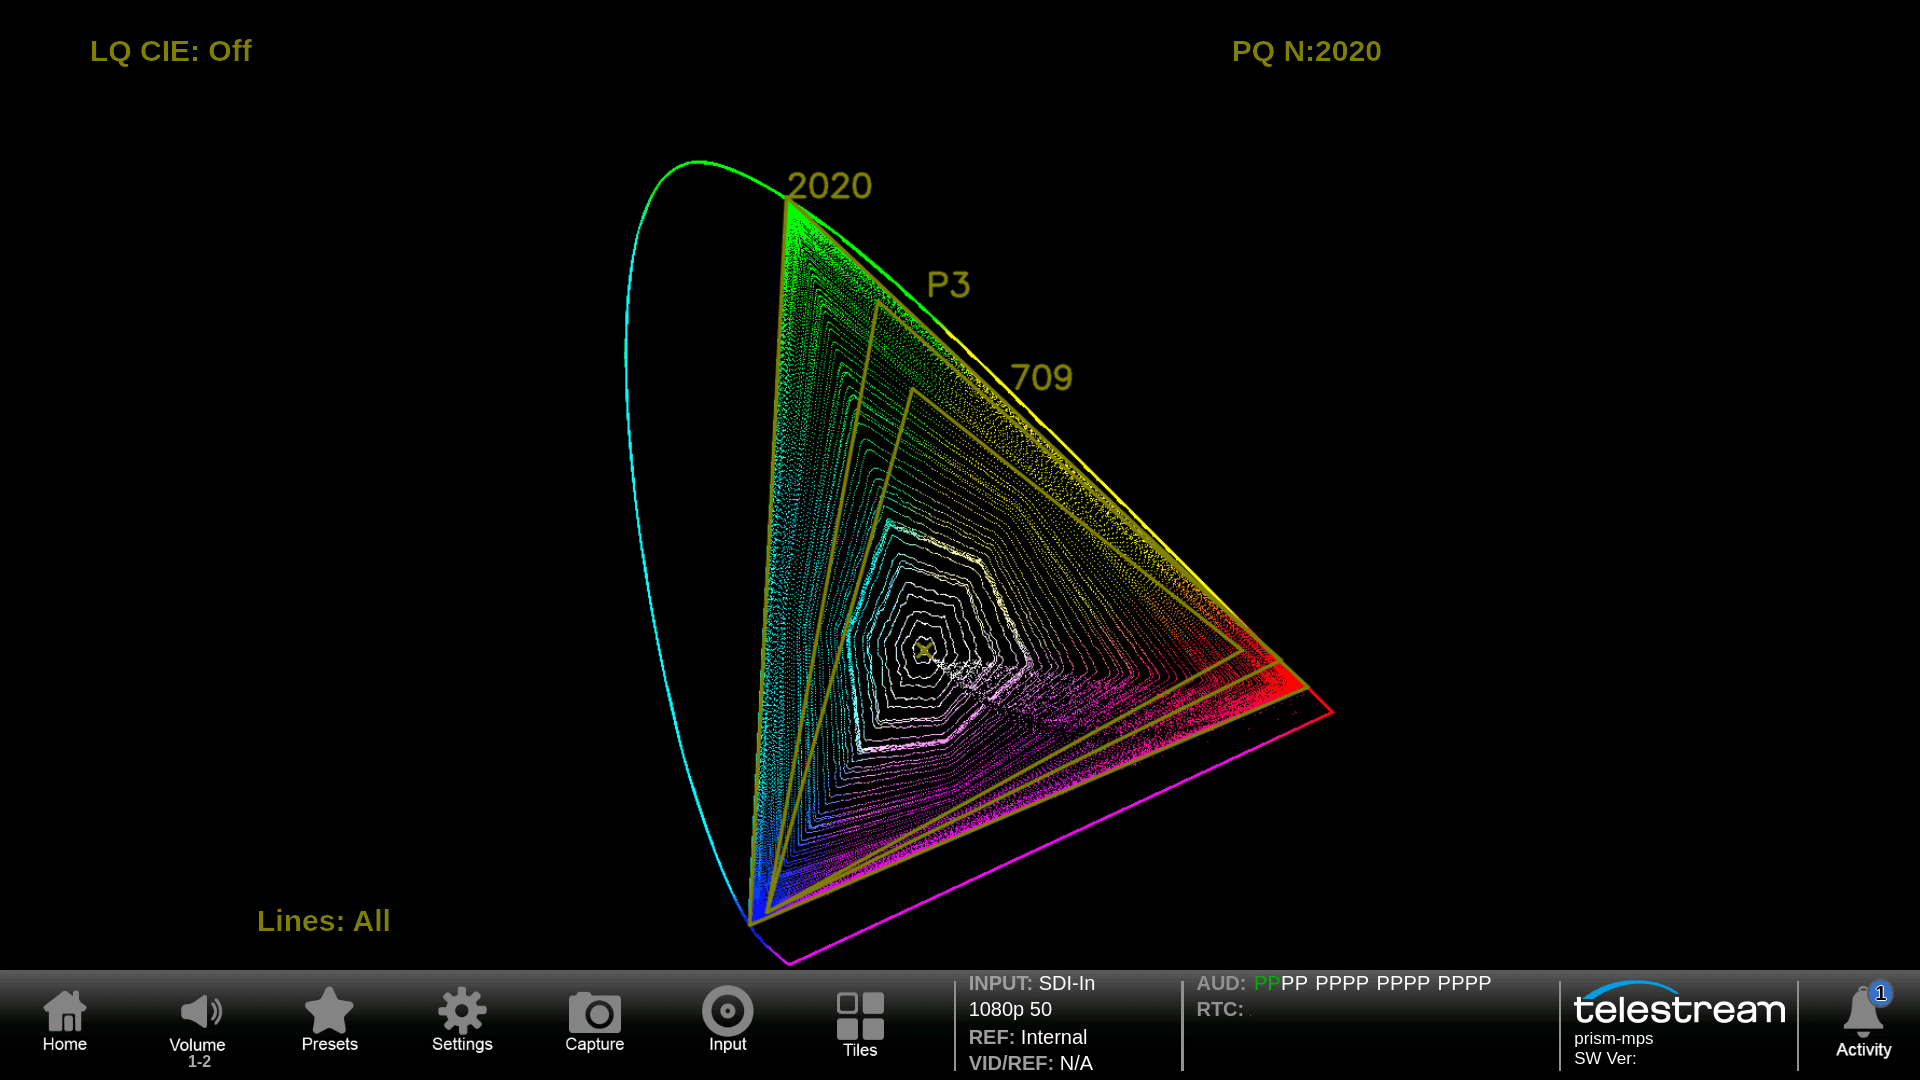
A Rainbow test pattern was applied to the input that contains all the RGB values. The input was configured for 2020 colorspace and the signal fills the 2020 graticule triangle.
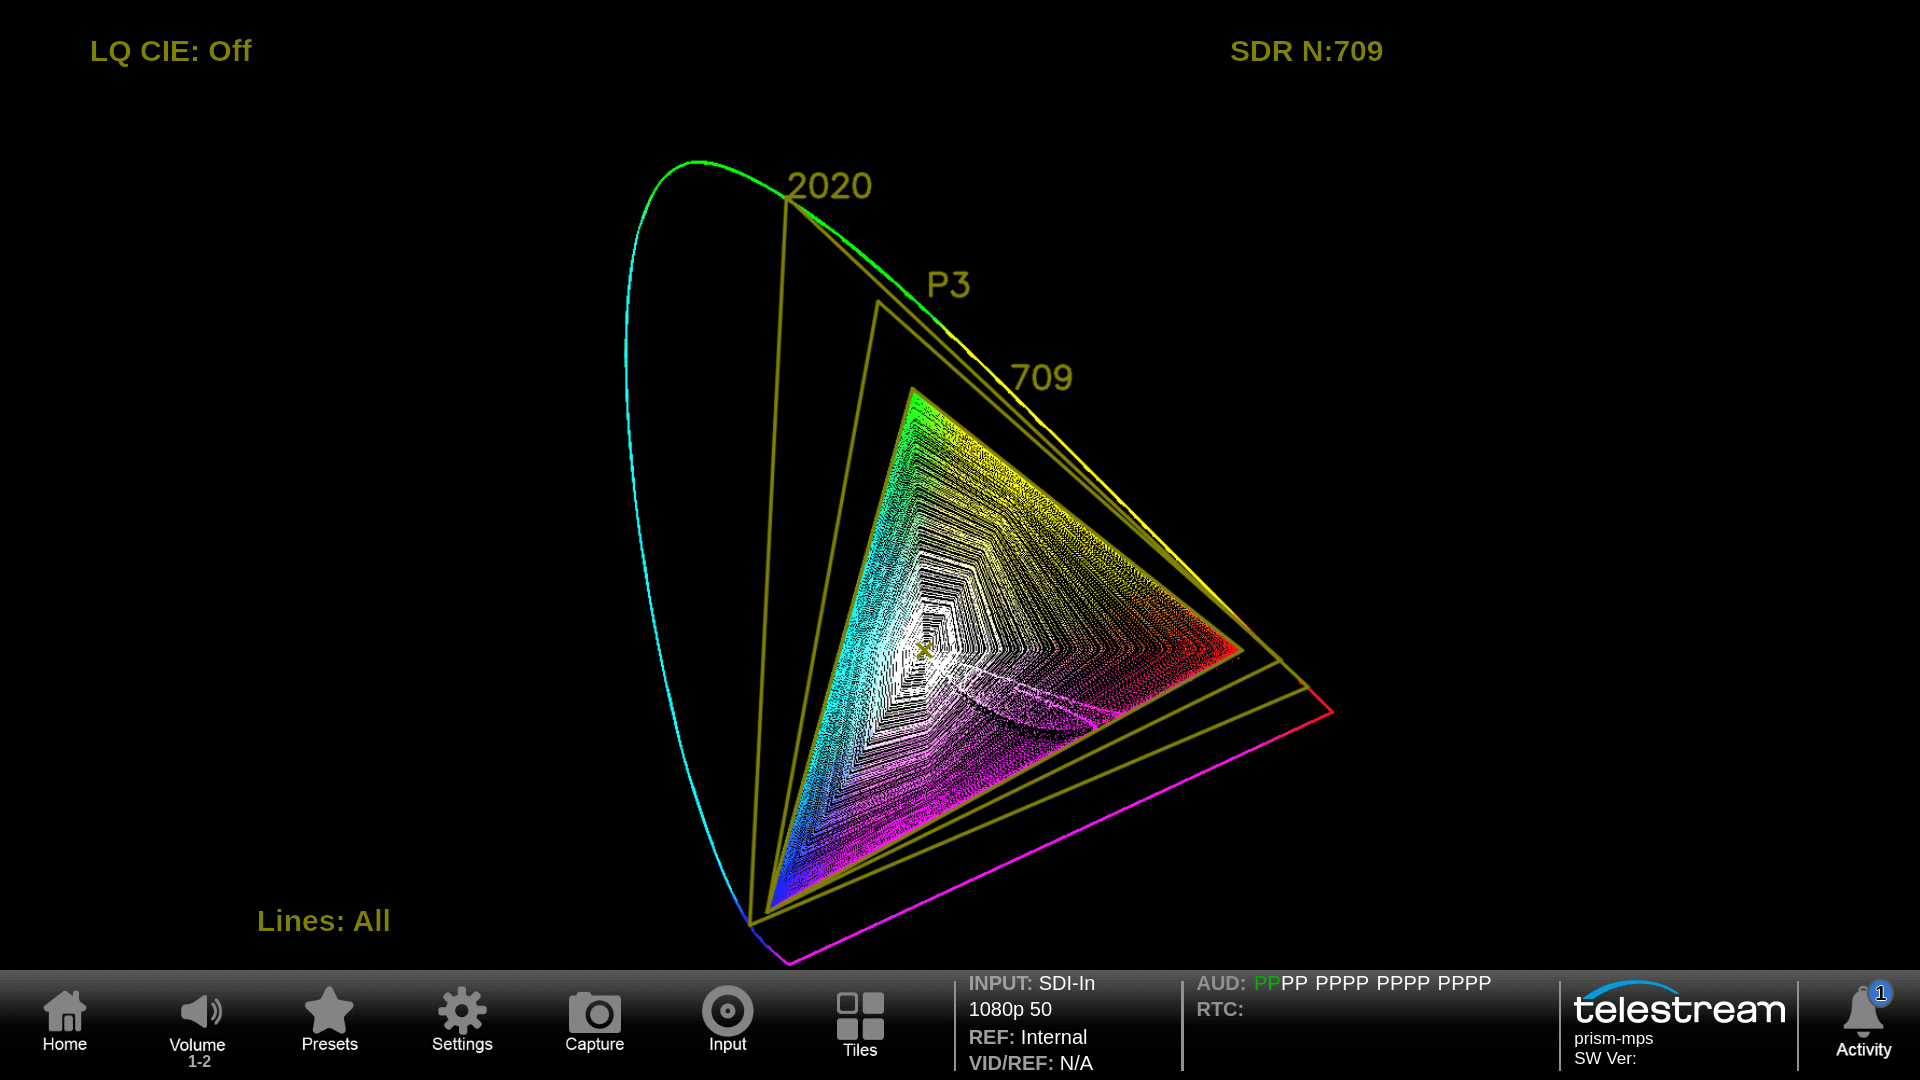
The input was configured for 709 colorspace and a Rainbow test signal was applied containing all the RGB values. You can see the 709 triangle is filled with all the possible colors.
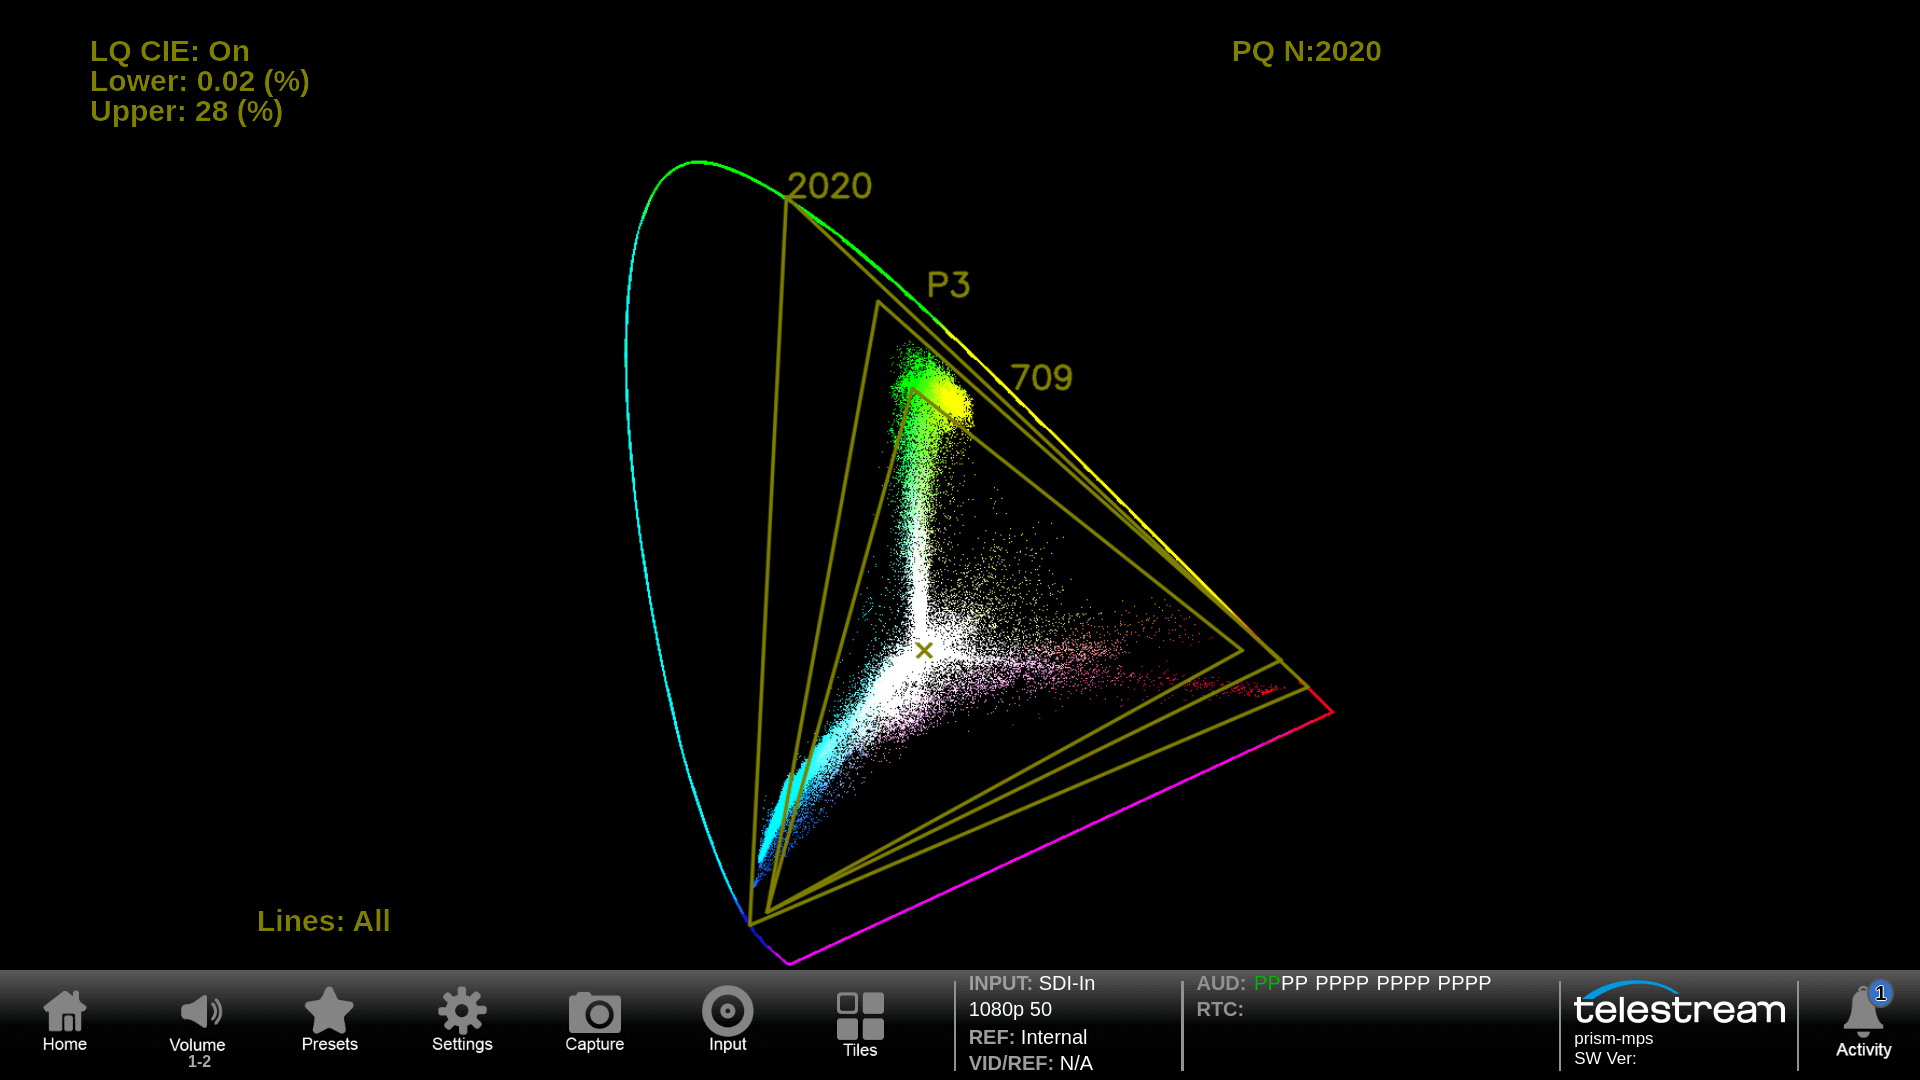
The Telestream Luma Qualified CIE allows the user to select a luma range such as highlights or shadows by which to limit the range of the CIE display. In this image the user has selected the shadows from 0.02-28% and can then see the color components outside the 709 triangle.
Stop Display
The Telestream Stop Display provides a tool to monitor the video signal with a variety of transfer function in a consistent manner. Requires option PROD to be installed in the instrument.
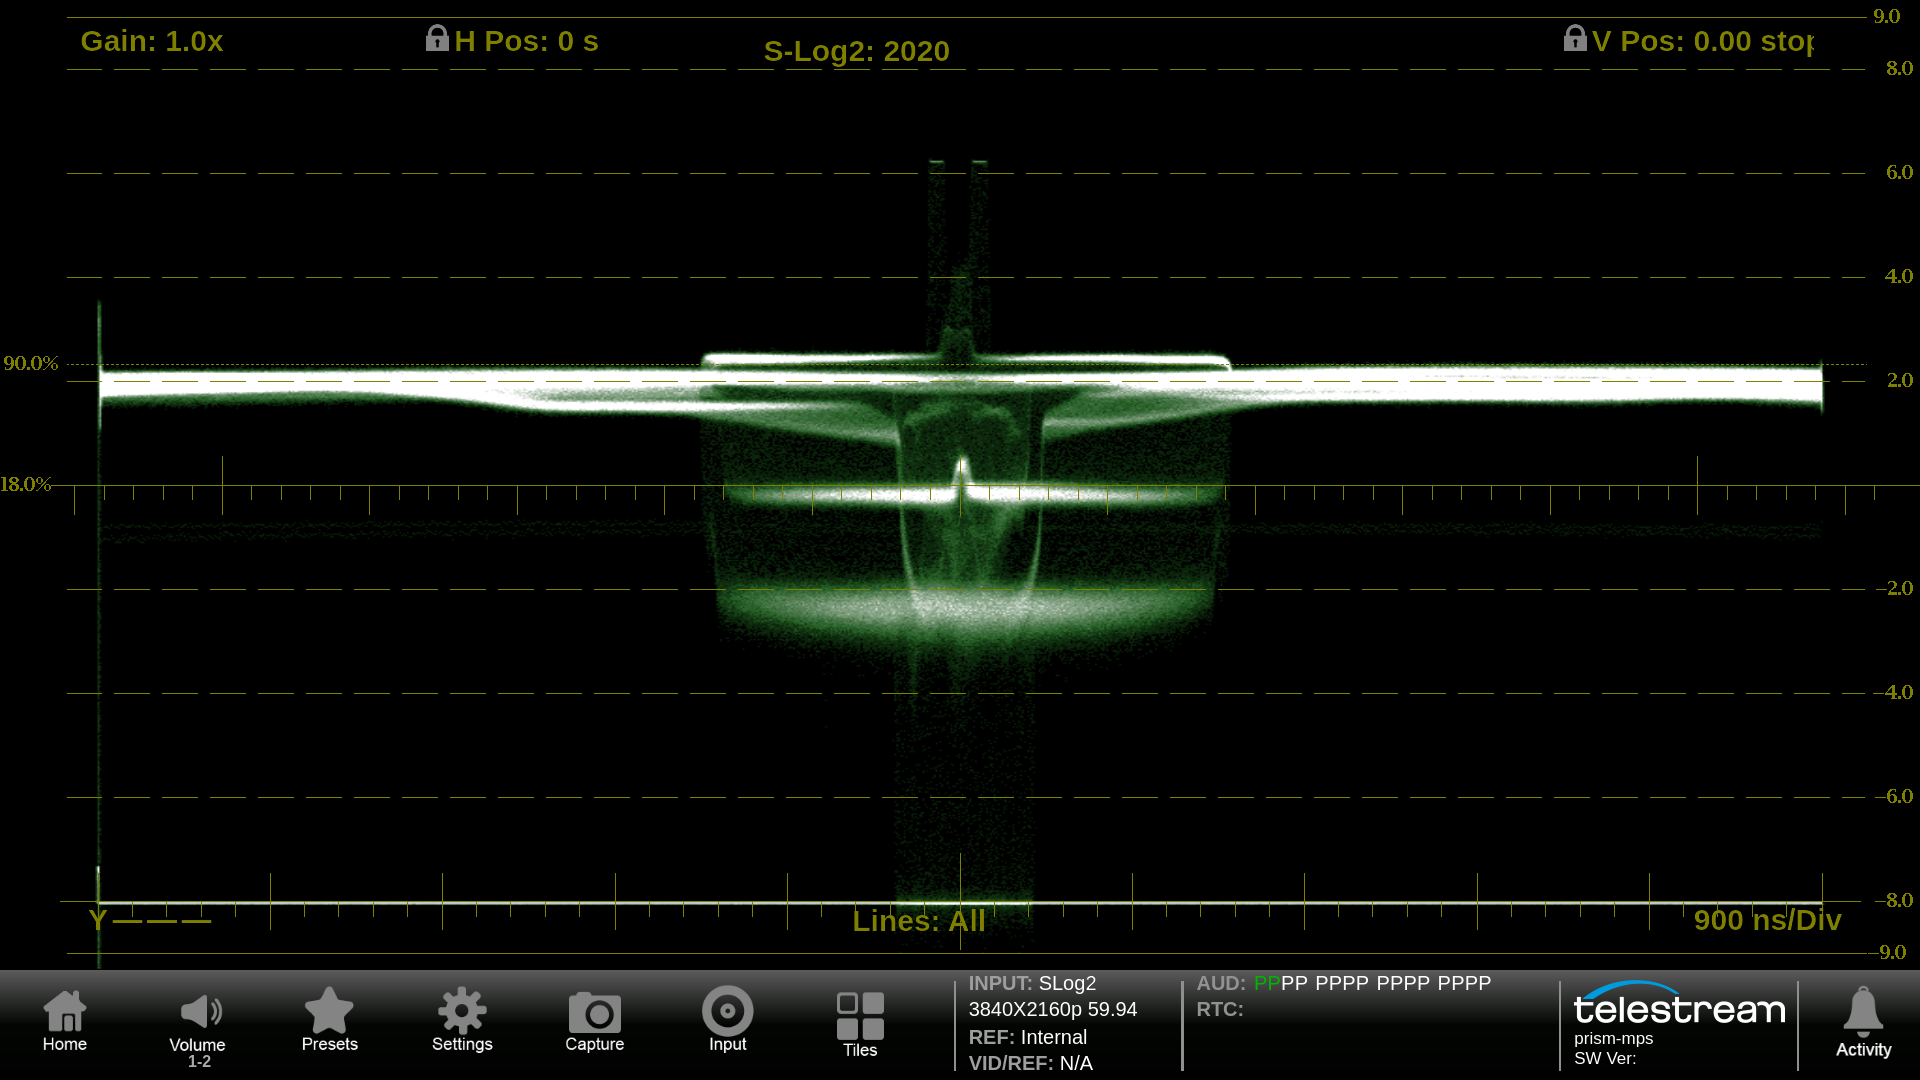
The Stop display is a logarithmic scale based on the input gamma transfer function that is configured. In this case S-Log 2 is setup as the gamma function and the Camera output was adjusted so that the 90% reflectance white and 18% grey levels were setup appropriately on the scale.
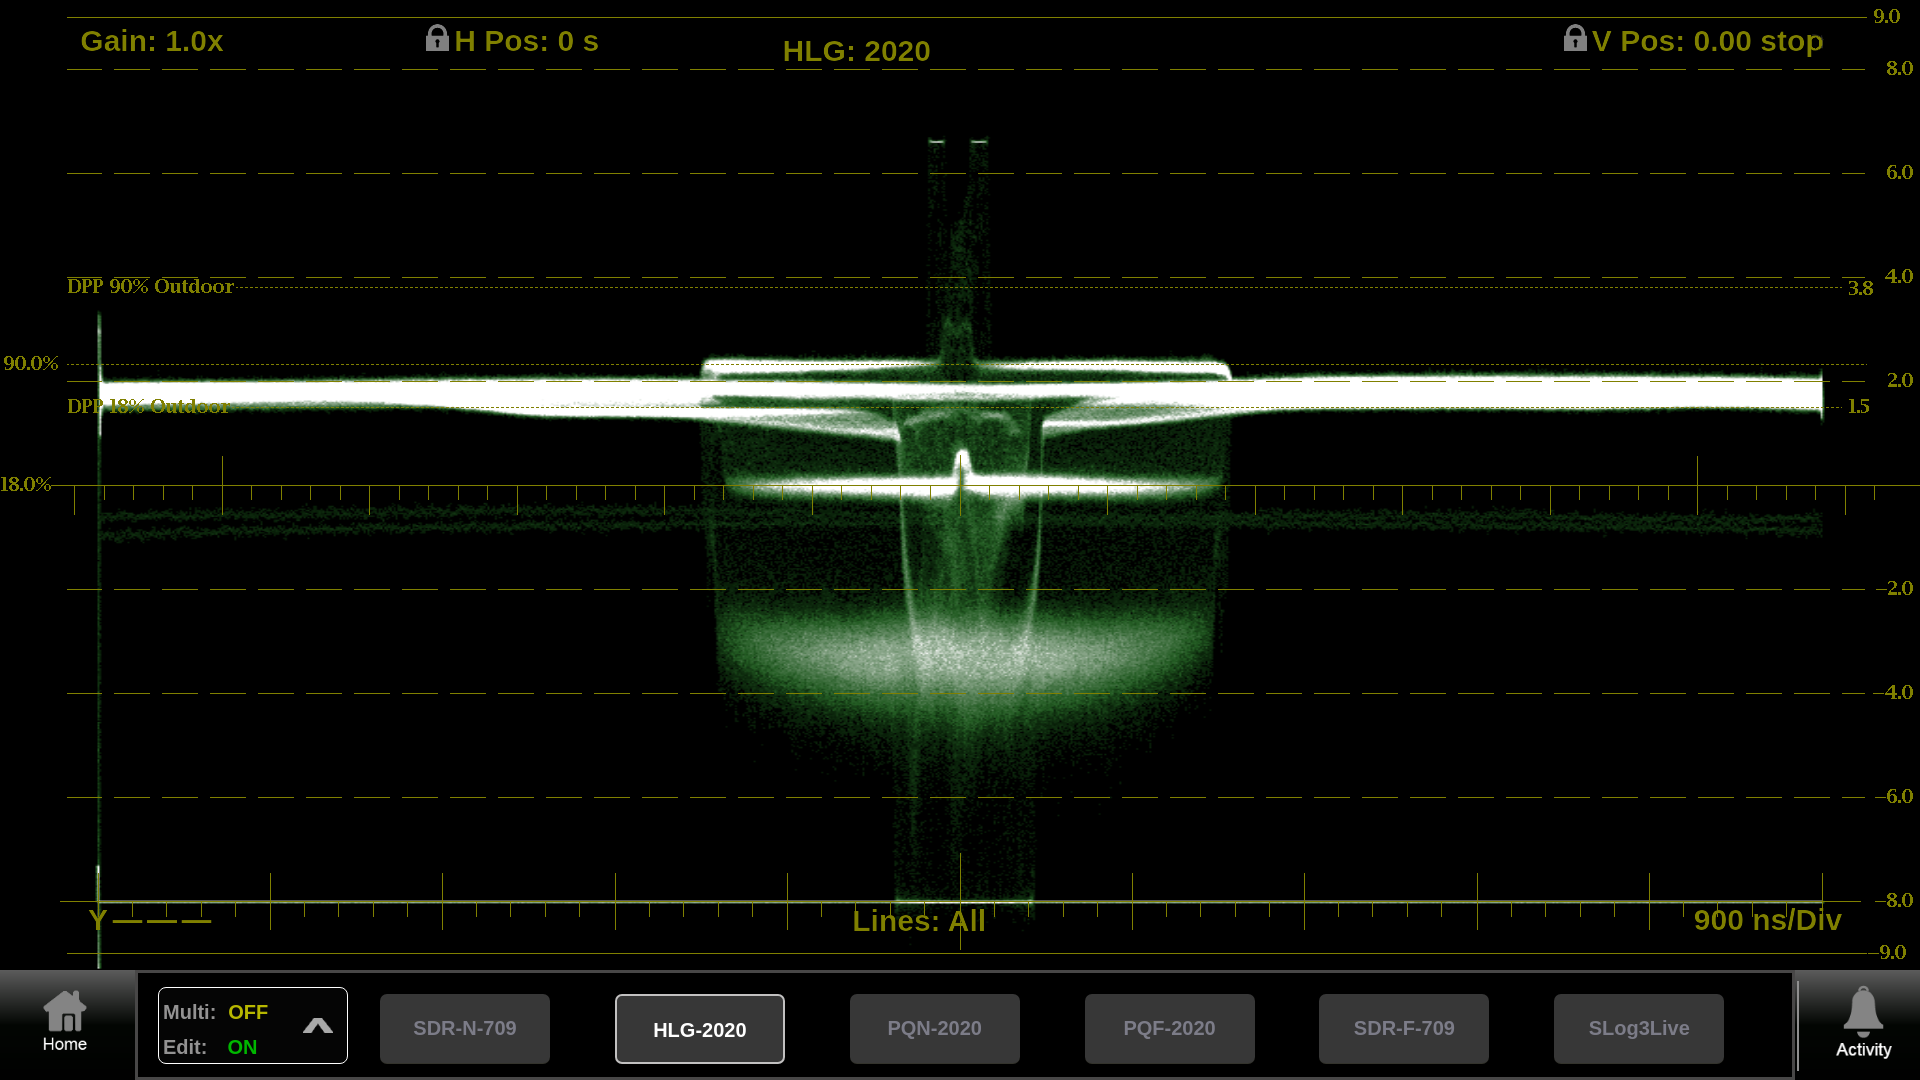
The gamma function on the input was configured for Hybrid Log Gamma (HLG) The input was then adjusted so that the 90% reflectance white and 18% grey level of the test scene were set at the appropriate levels.
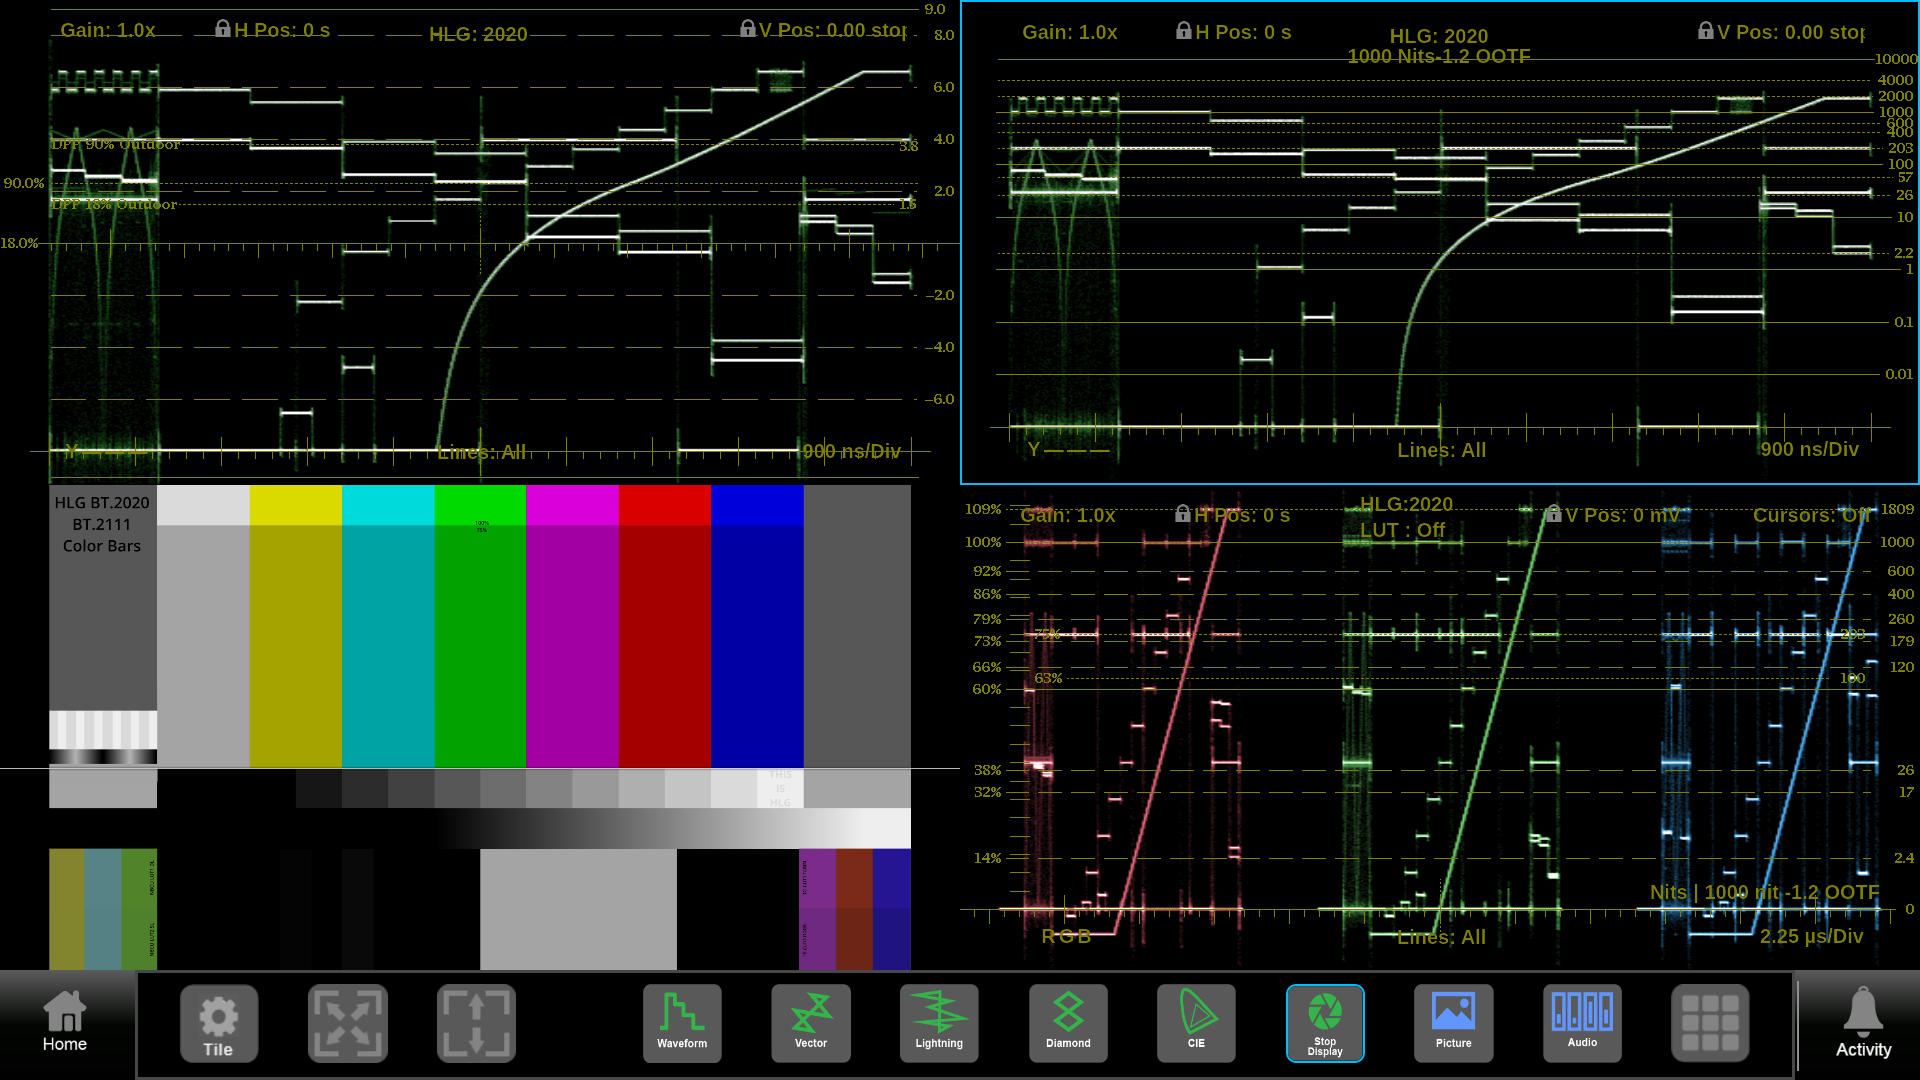
Stop display timed aligned with the picture display for easier correlation between picture and trace. The Stop display can be configured for Scene (Stops) or Display (Nits) light as shown in tiles one and two.
CAM
Camera Alignment Monitoring allows the user to compare up to four SDI input waveform traces with the ability to add a thumbnail picture and label identification of the signal format. Option MULTI is required for this application.
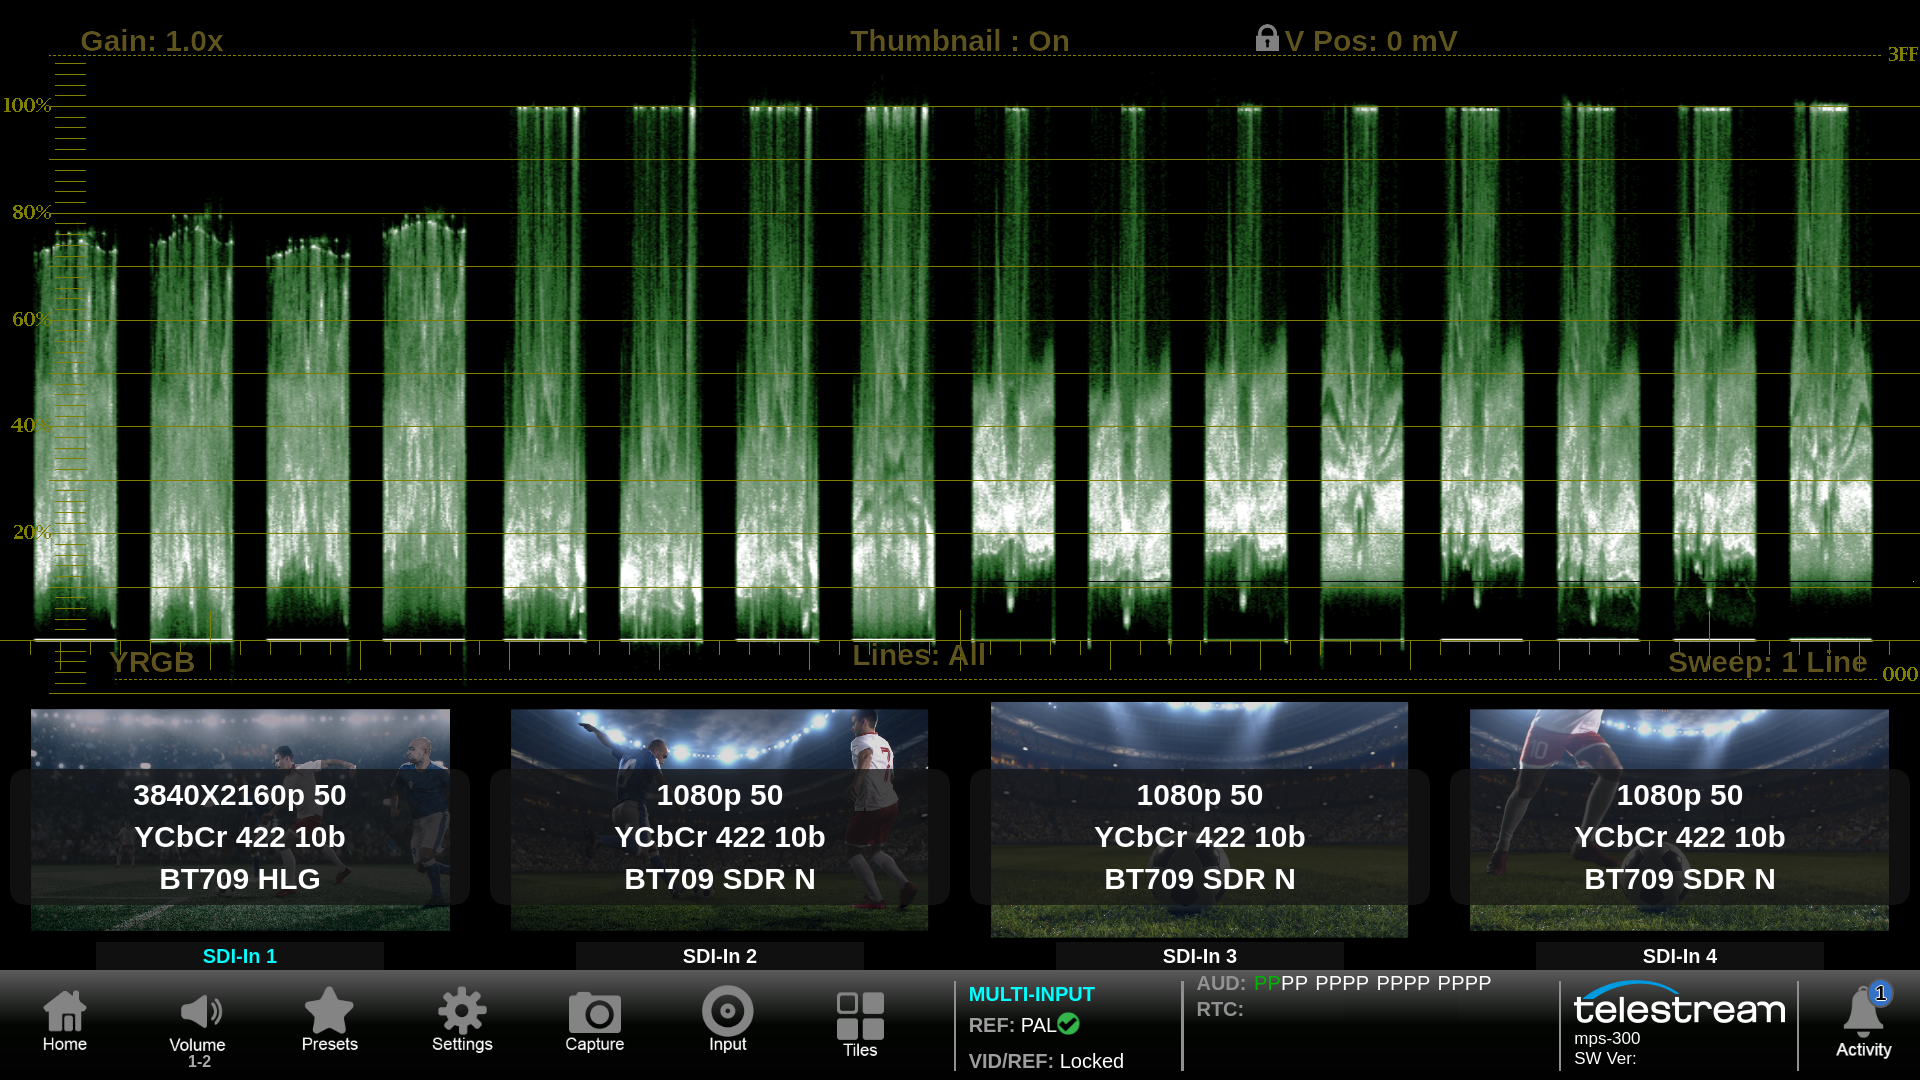
The CAM display shows four SDI inputs parade side by side in this case in YRGB format. This display is ideal for camera shading application and allows for comparison of the input levels of each input signal. A thumbnail image helps identify the content of the input signals and on-screen labels aids the user in determining the format of the signal.
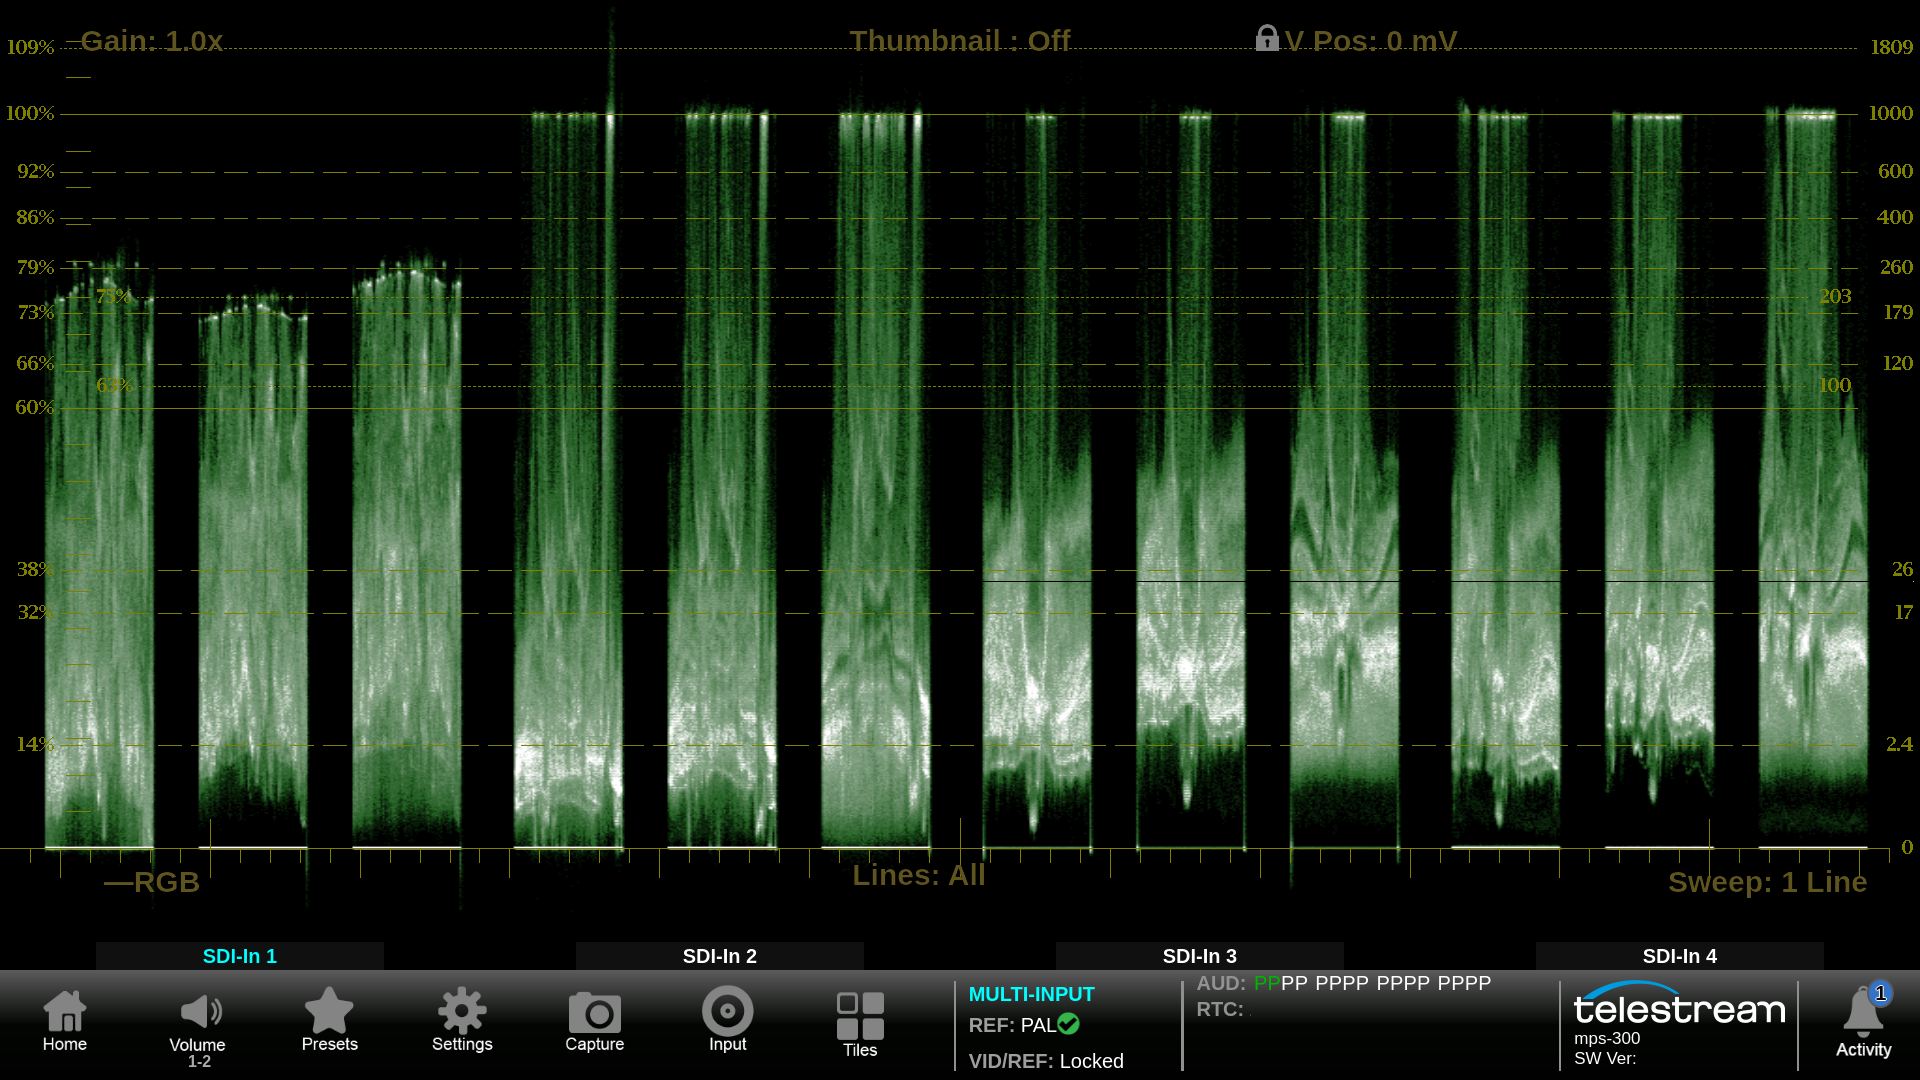
Here a parade of the RGB signal for each input is provided to allow the operator to check the levels and balance of each input. The trace display is maximized when the thumbnail is not enabled within the display.
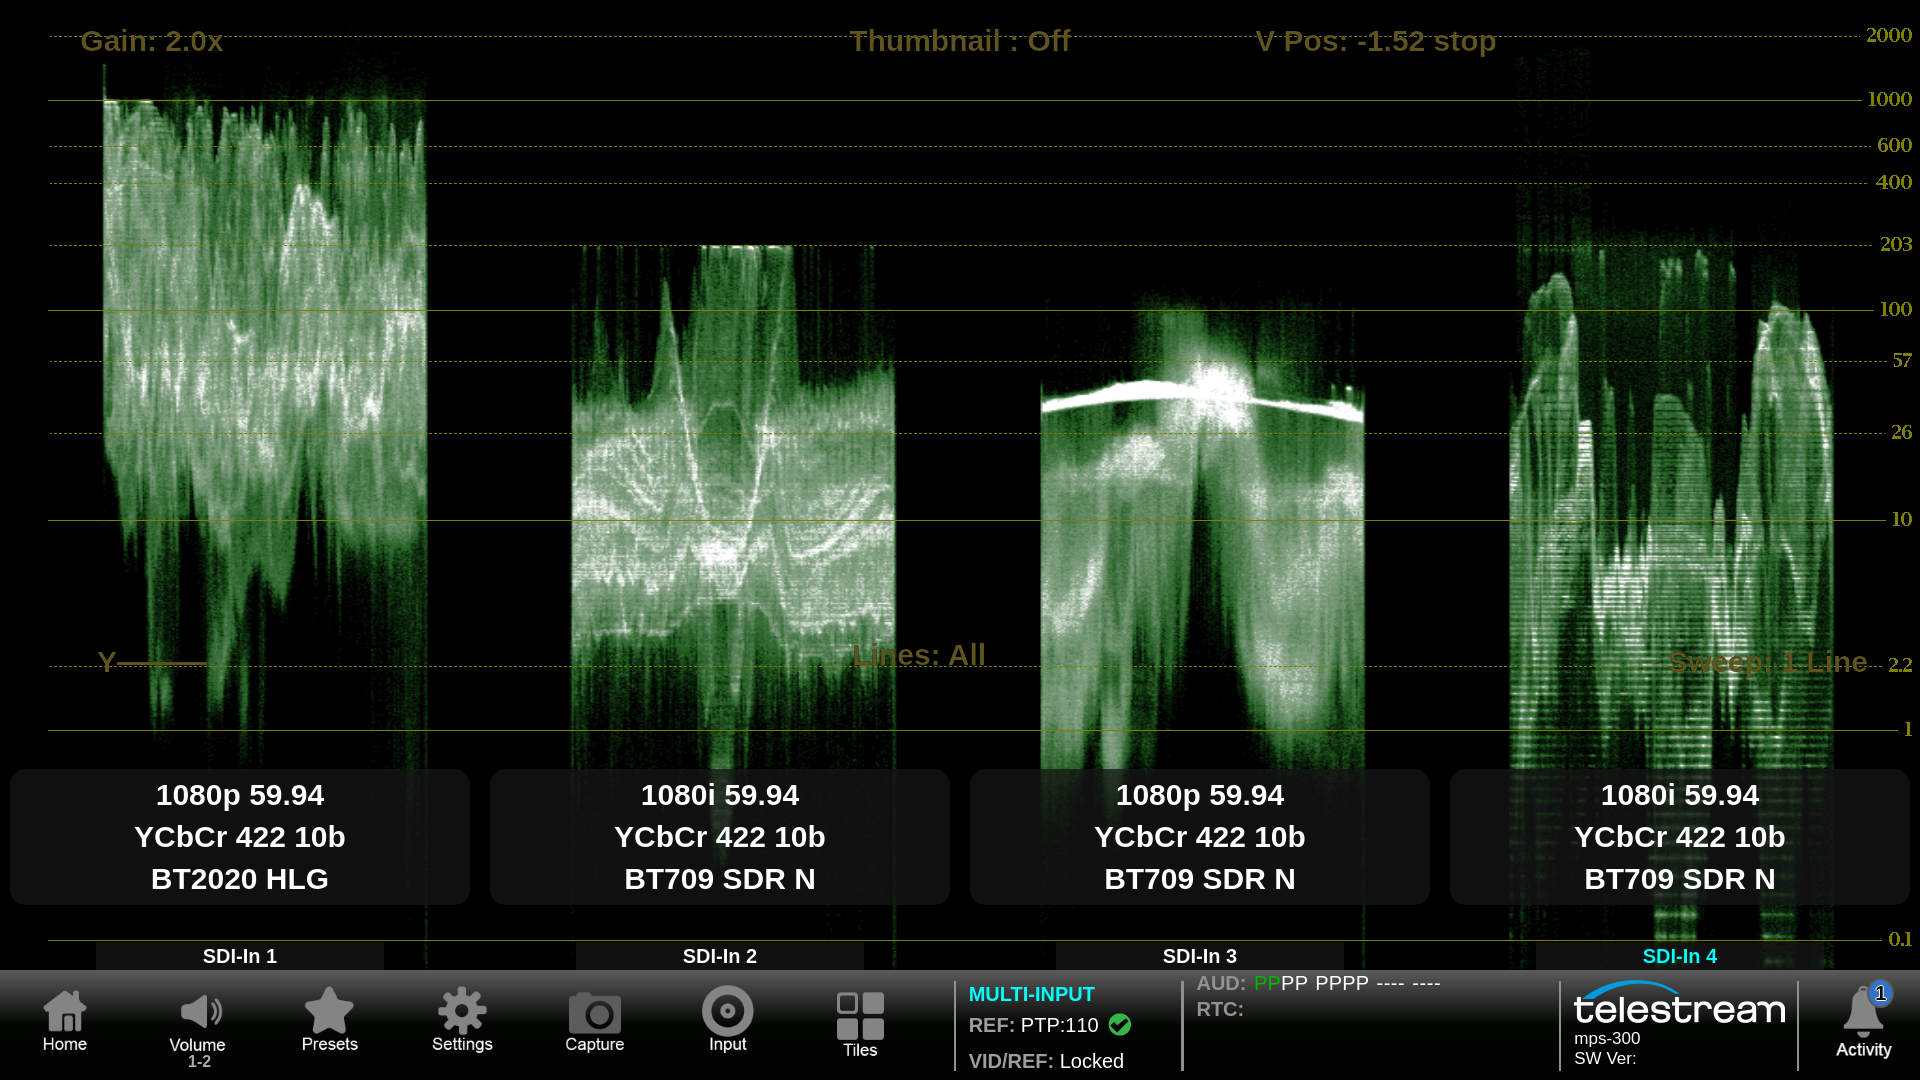
Using the Telestream Stop display with a parade of the four SDI inputs as Y only traces. Graticule lines are shown in Nits with two times gain to maximum the trace between 203 Nits and 1000 Nits to aid the operator in adjusting the reference white level between the sources.
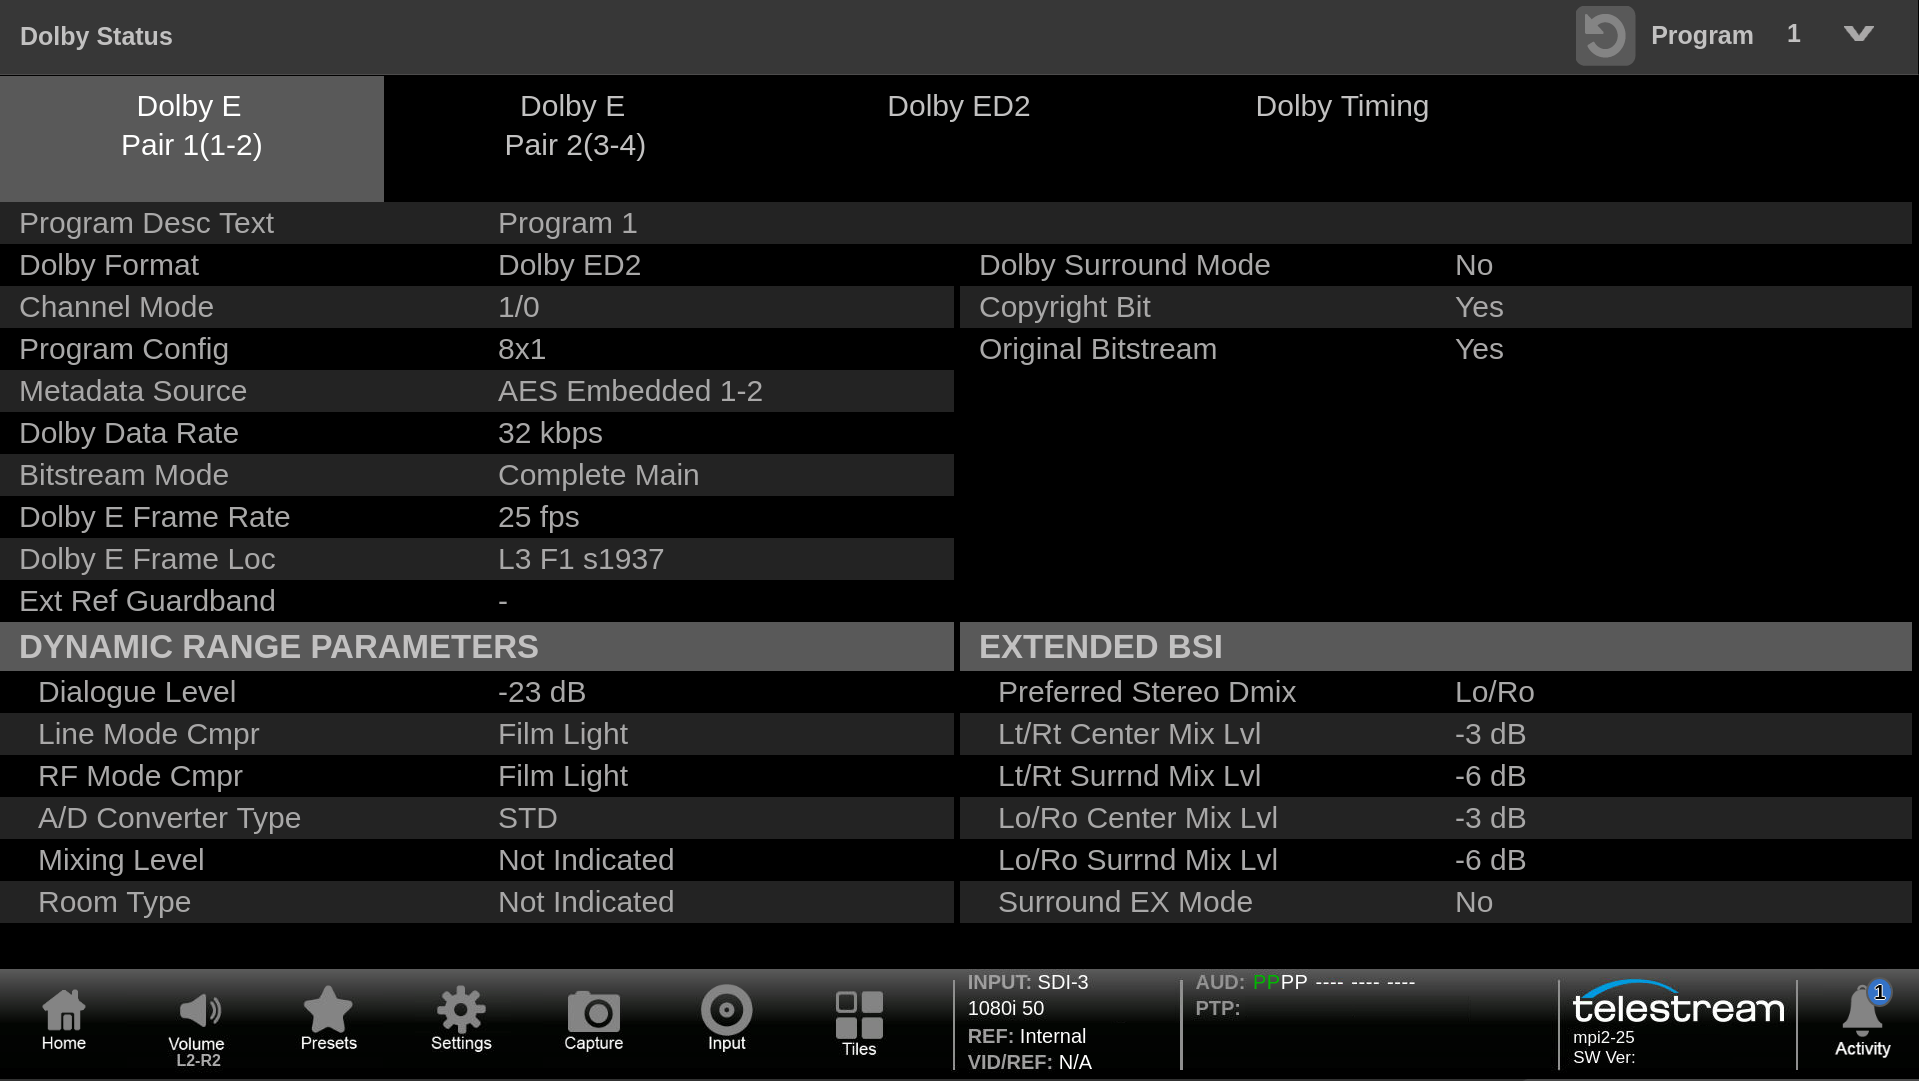
Dolby Status
Dolby Status display decodes the Dolby metadata present within a Dolby ED2, E, D or D+ signal. The AUD option is required and if the user want to decode the Dolby signal option DLBY is required.
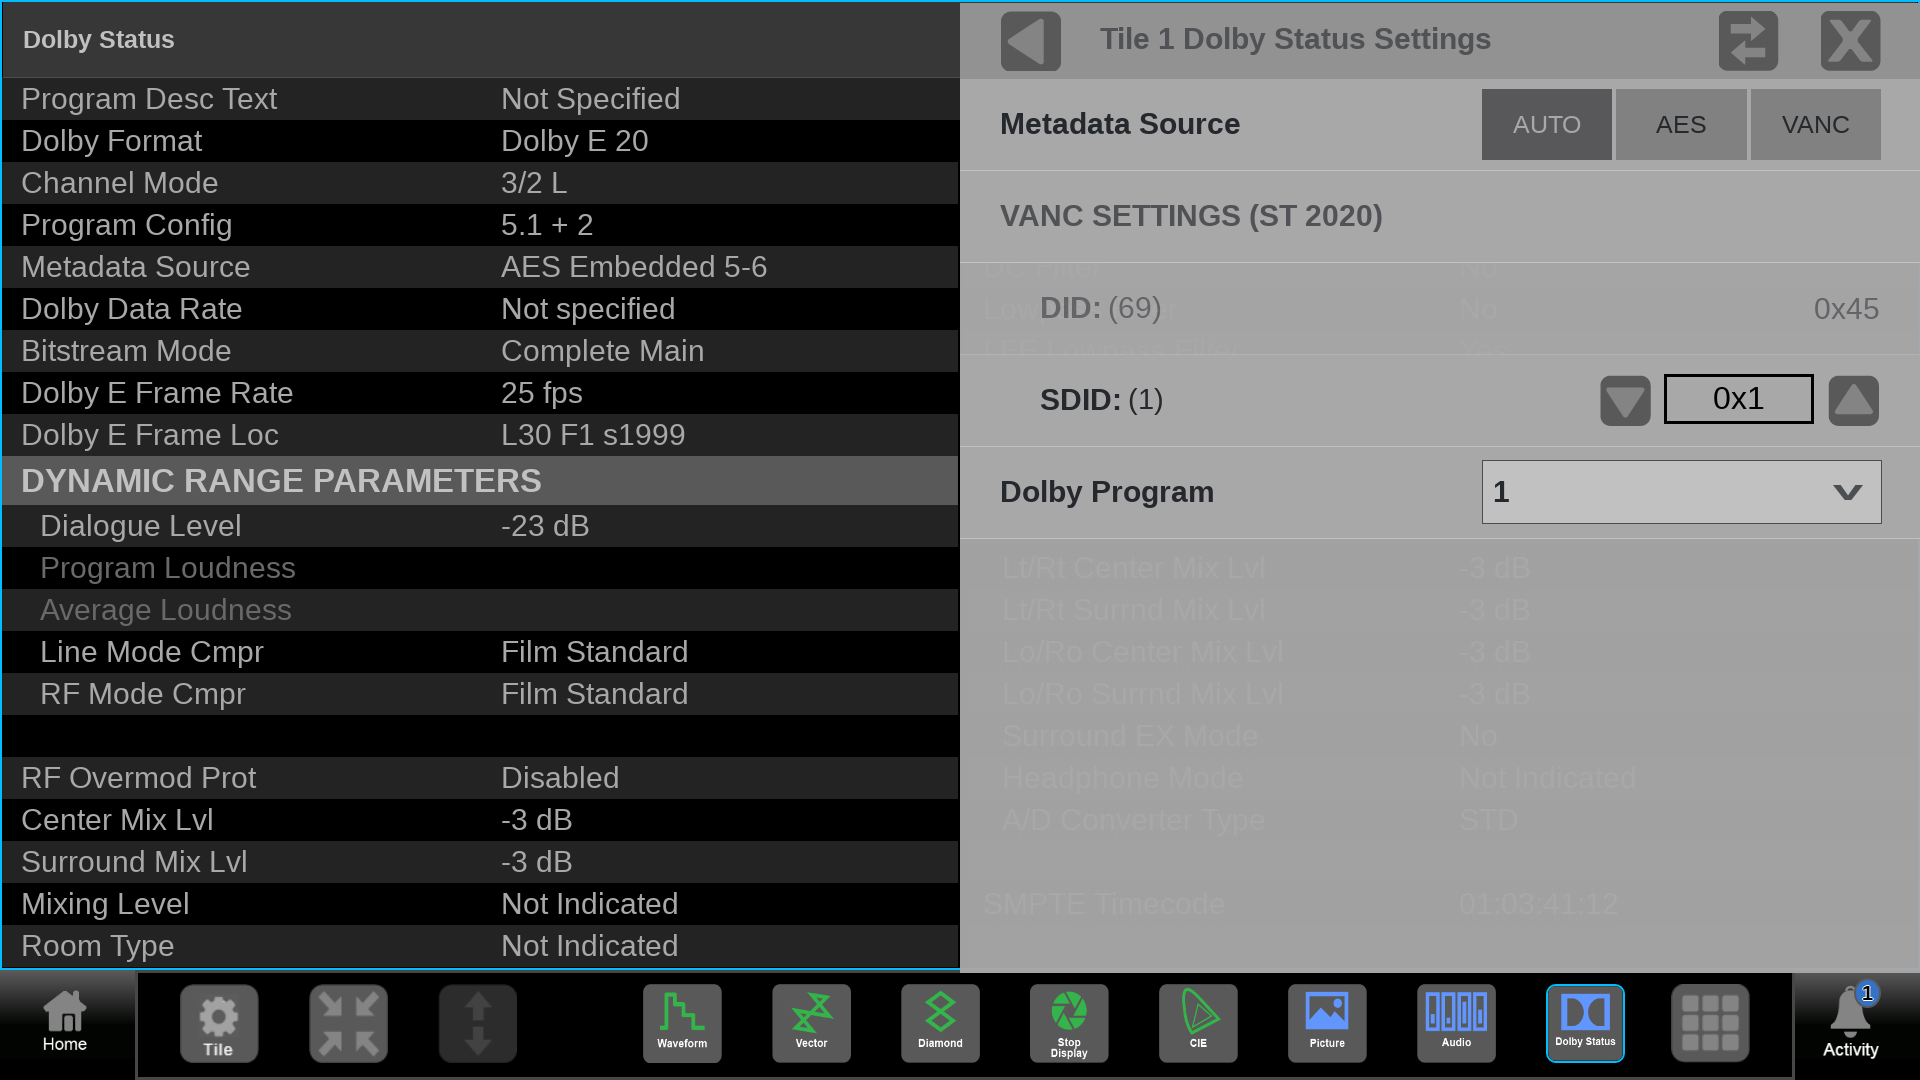
Dolby Status display is available for Dolby metadata present in ANC or within the Dolby signal.
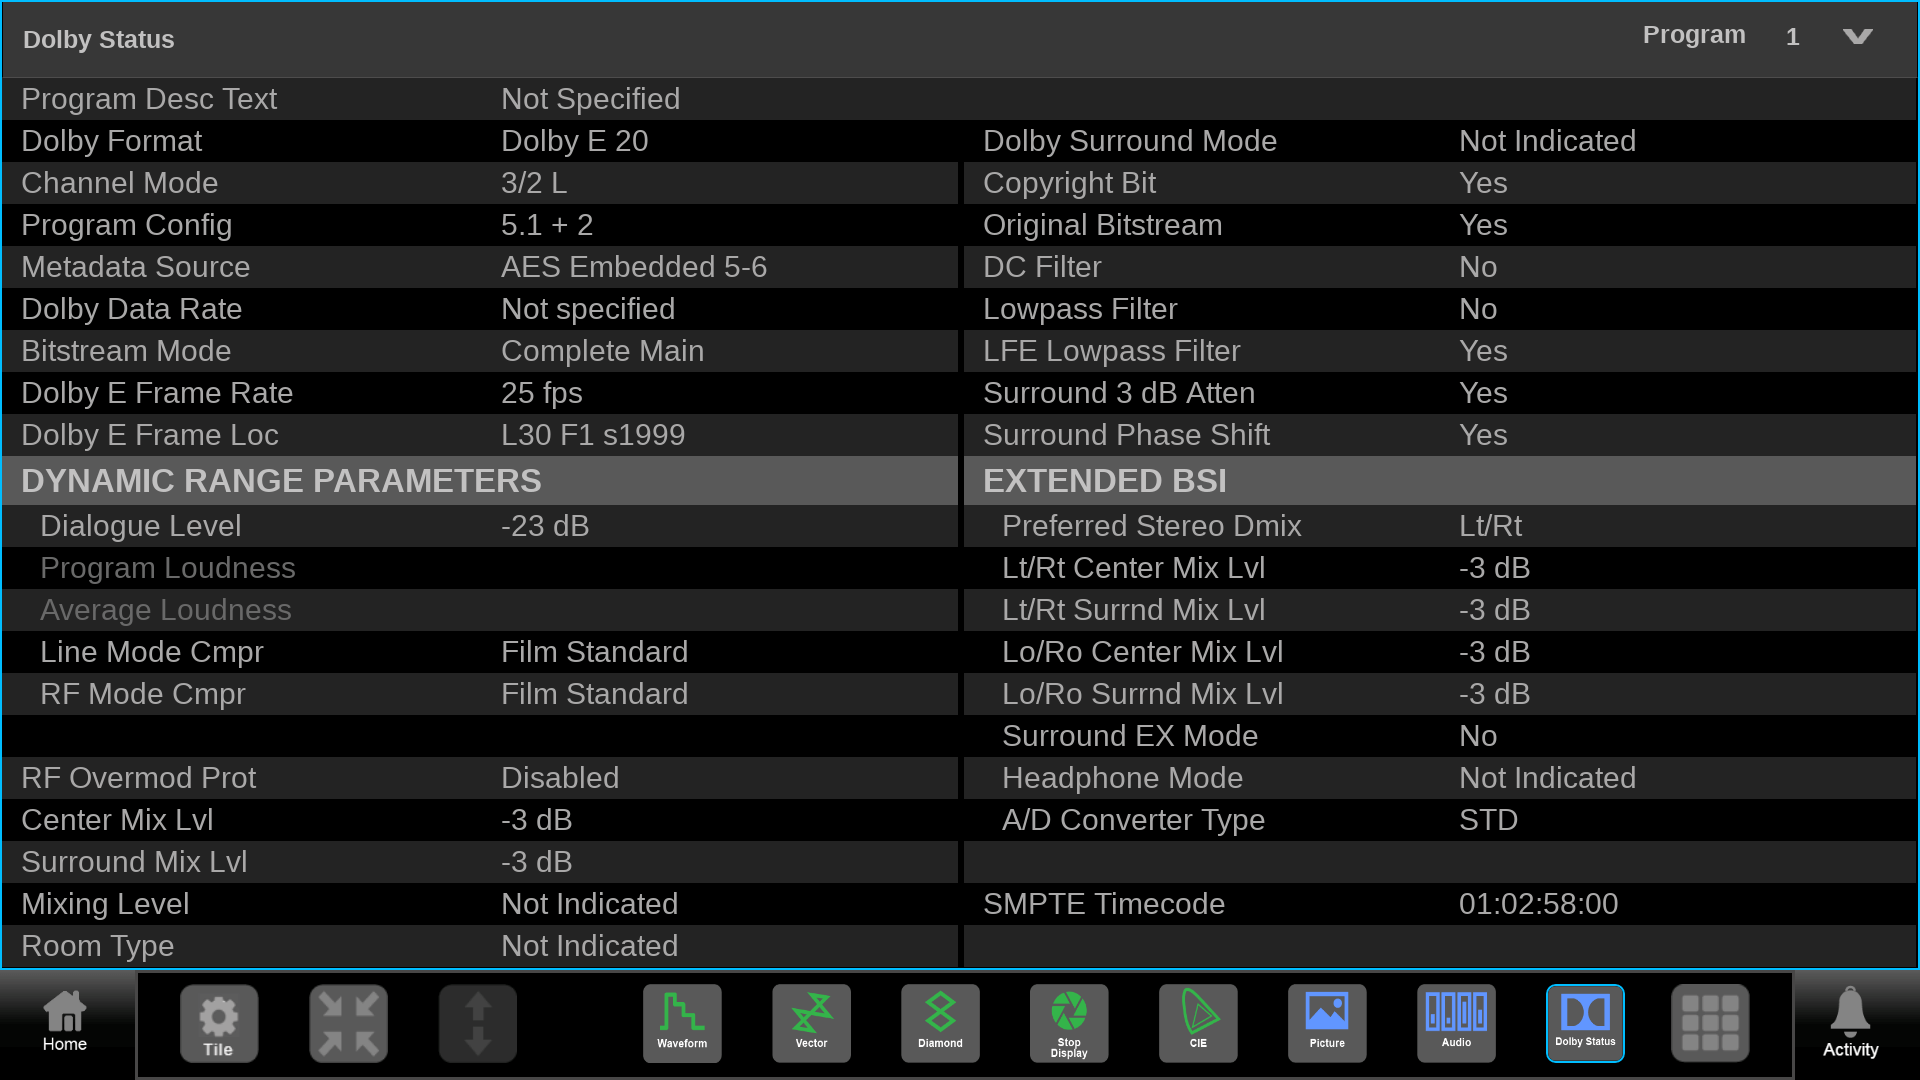
When Dolby E metadata is decoded the Dolby E Frame Location (Guardband) for the start of the metadata is shown within the display. The metadata shows the Dialnorm, Dynamic Range and Downmix parameters of the signal.
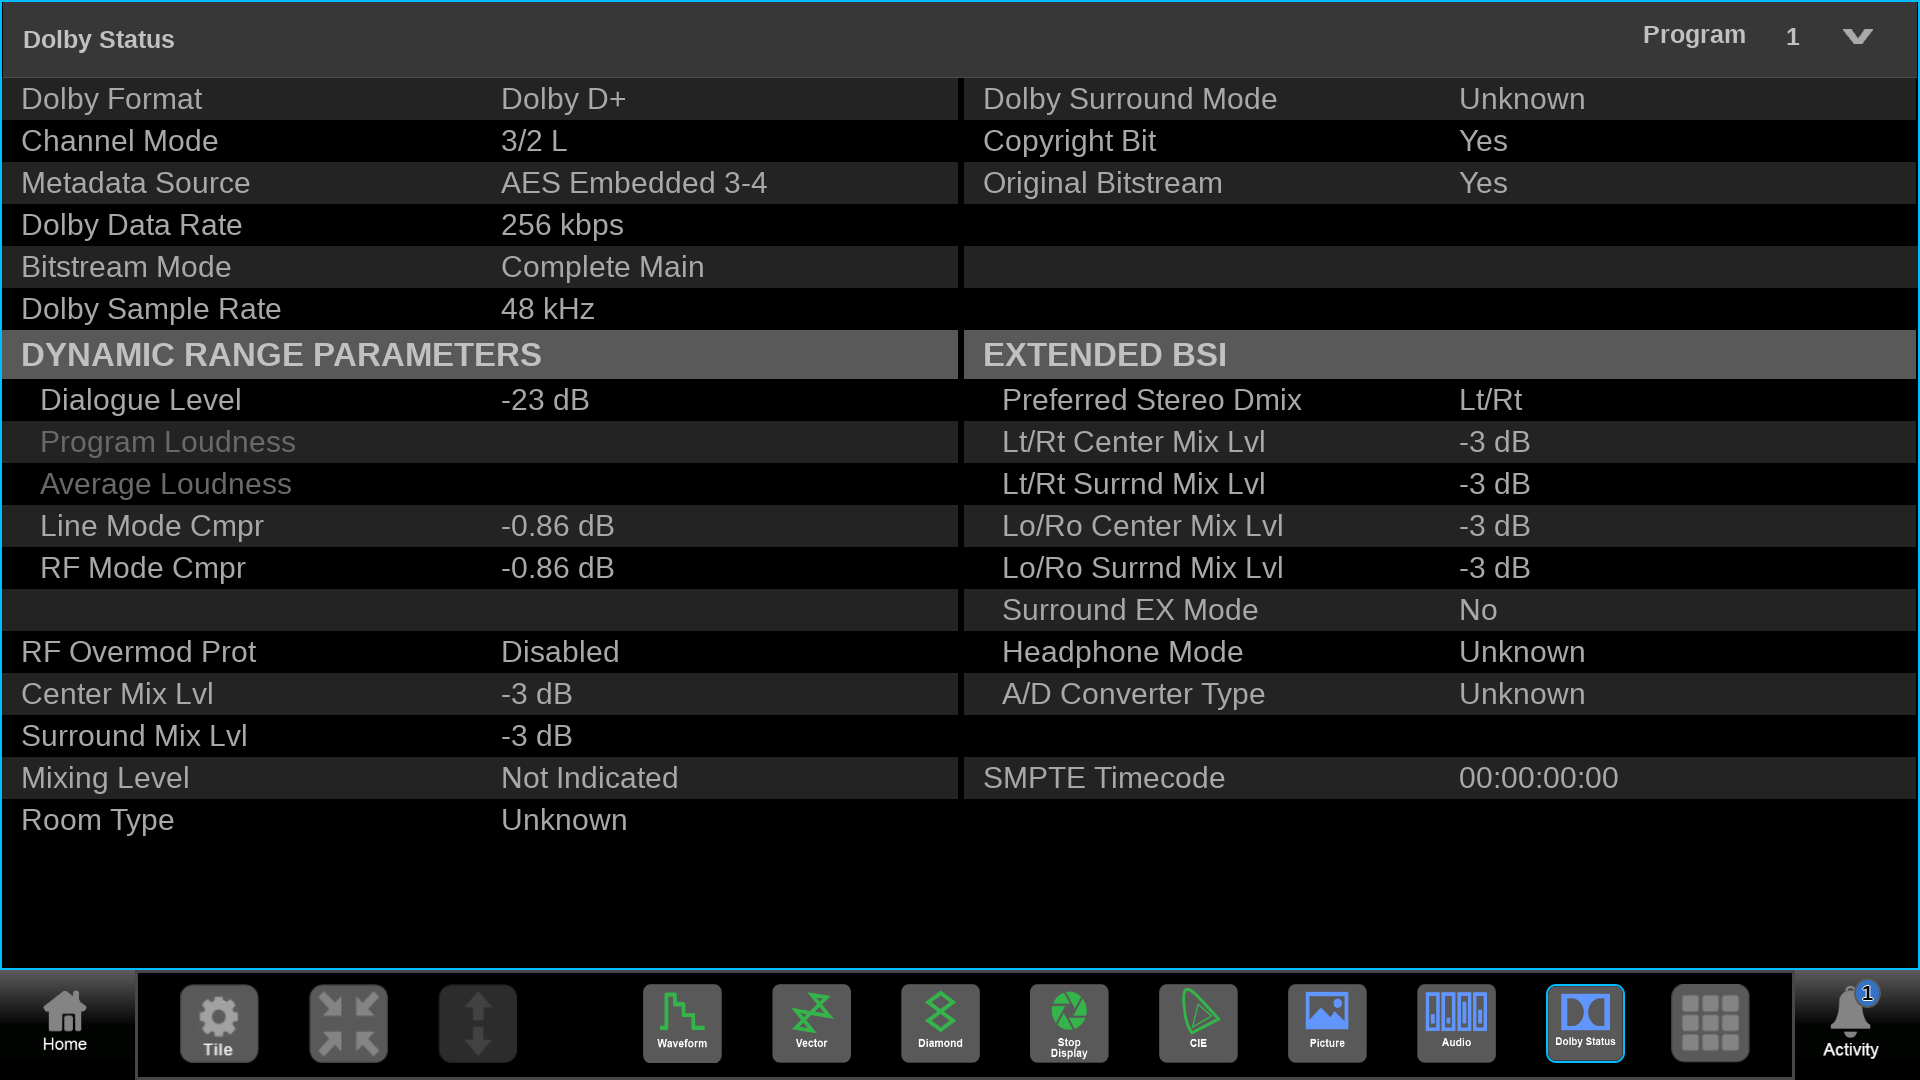
When Dolby Digital or Digital Plus is decode information on the Data Rate, Channel & Bitstream Modes are displayed. Along with the metadata parameters for Dialogue Level, Dynamic Range and Downmix.
When Dolby ED2 stream is received, Dolby E metadata in pair 1 and pair 2 are displayed in two tabs in Dolby Status display.
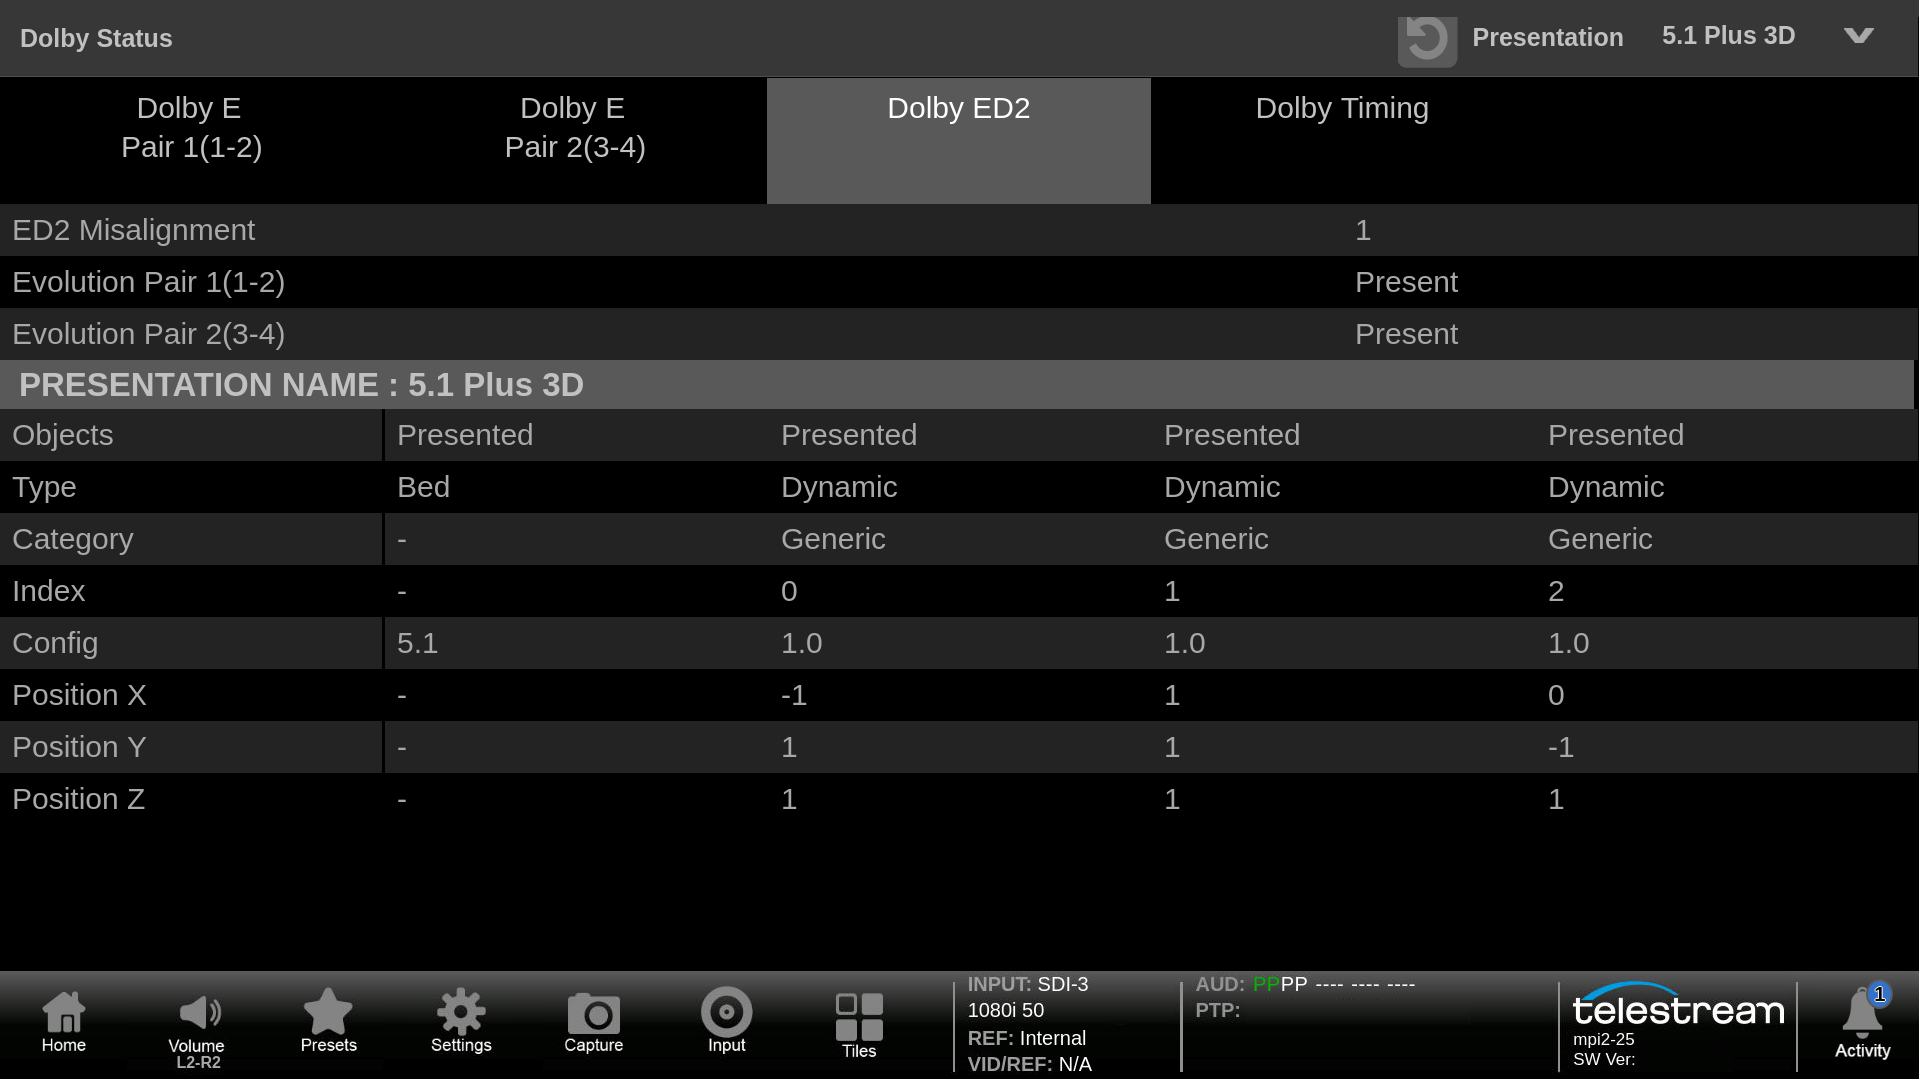
Dolby ED2 tab shows Dolby ED2 metadata including Objects in each Presentation with type and X/Y/Z location information.
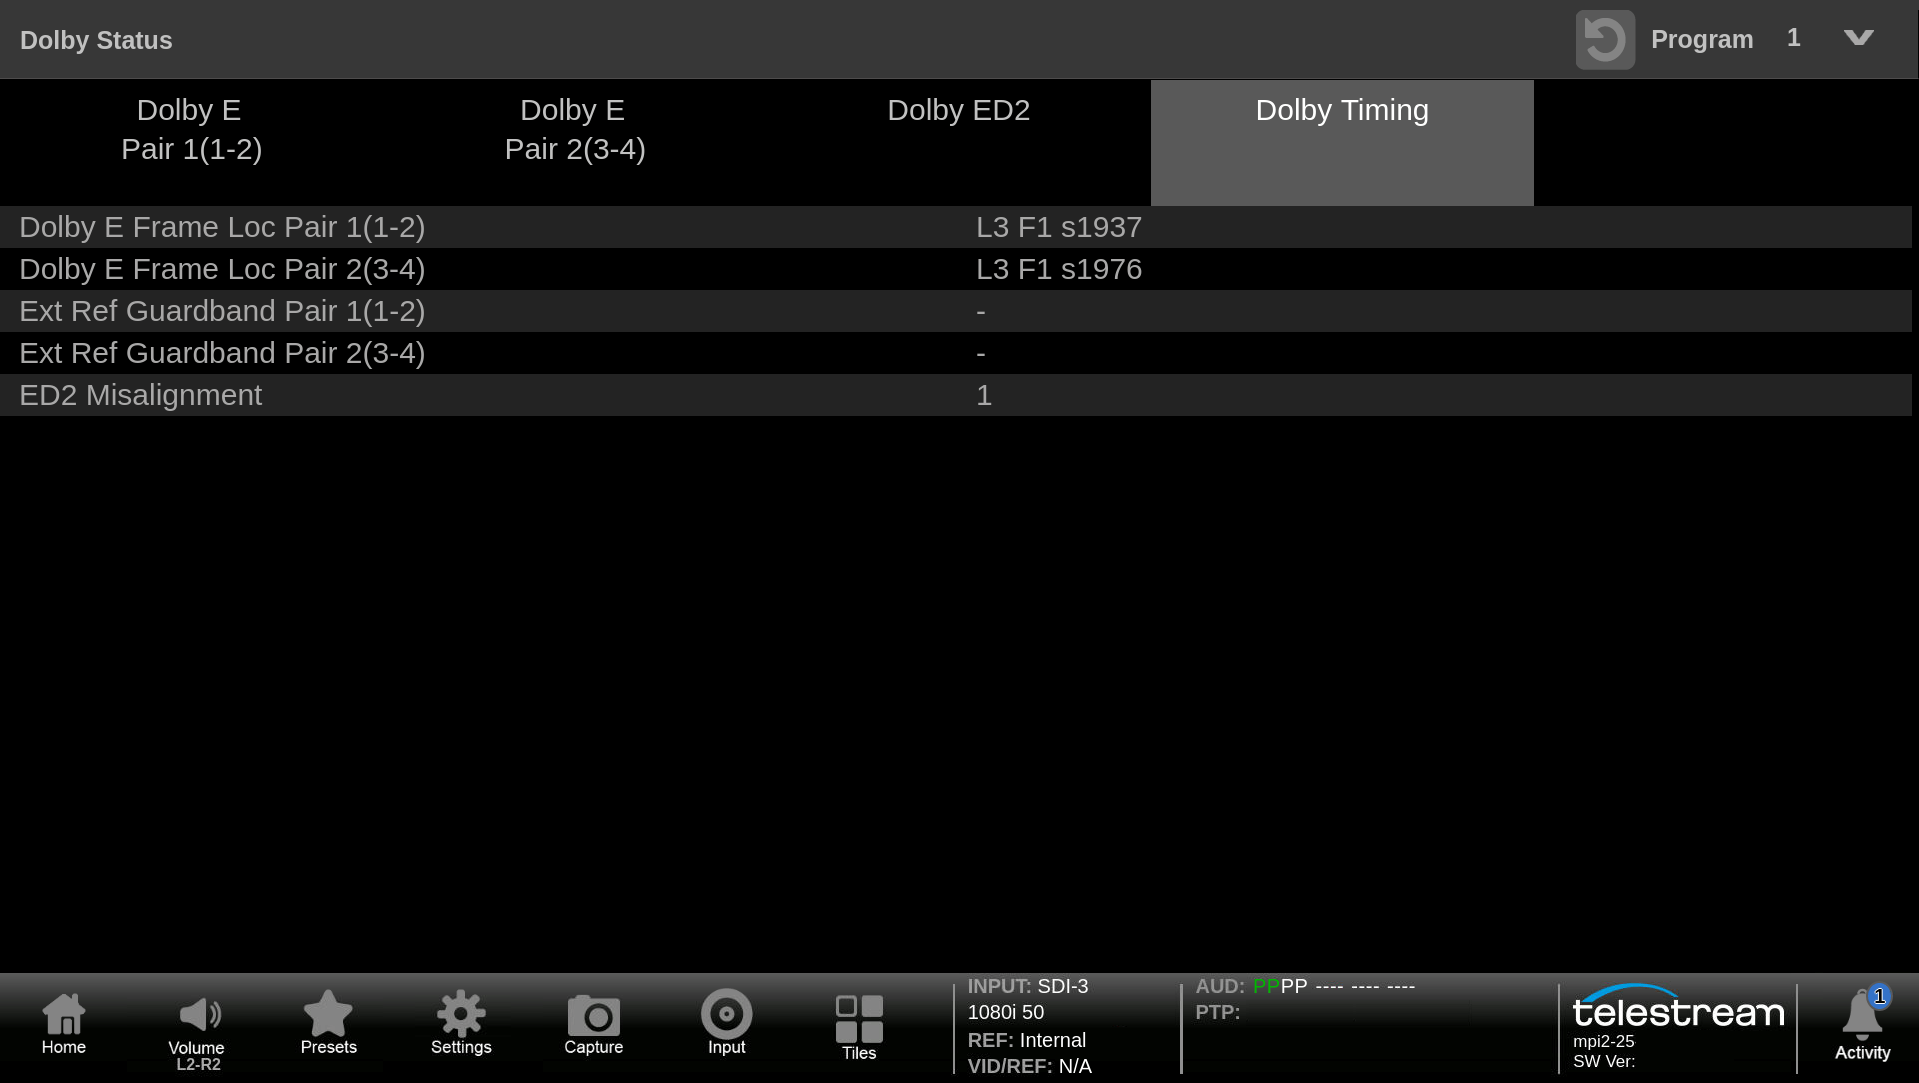
Dolby Timing tab shows Dolby E preamble location in SDI stream and location against house reference signal, BB or PTP.
AES Channel Status
AES Channel Status is available for SDI Embedded audio and provides decoding of the channel status syntax information.
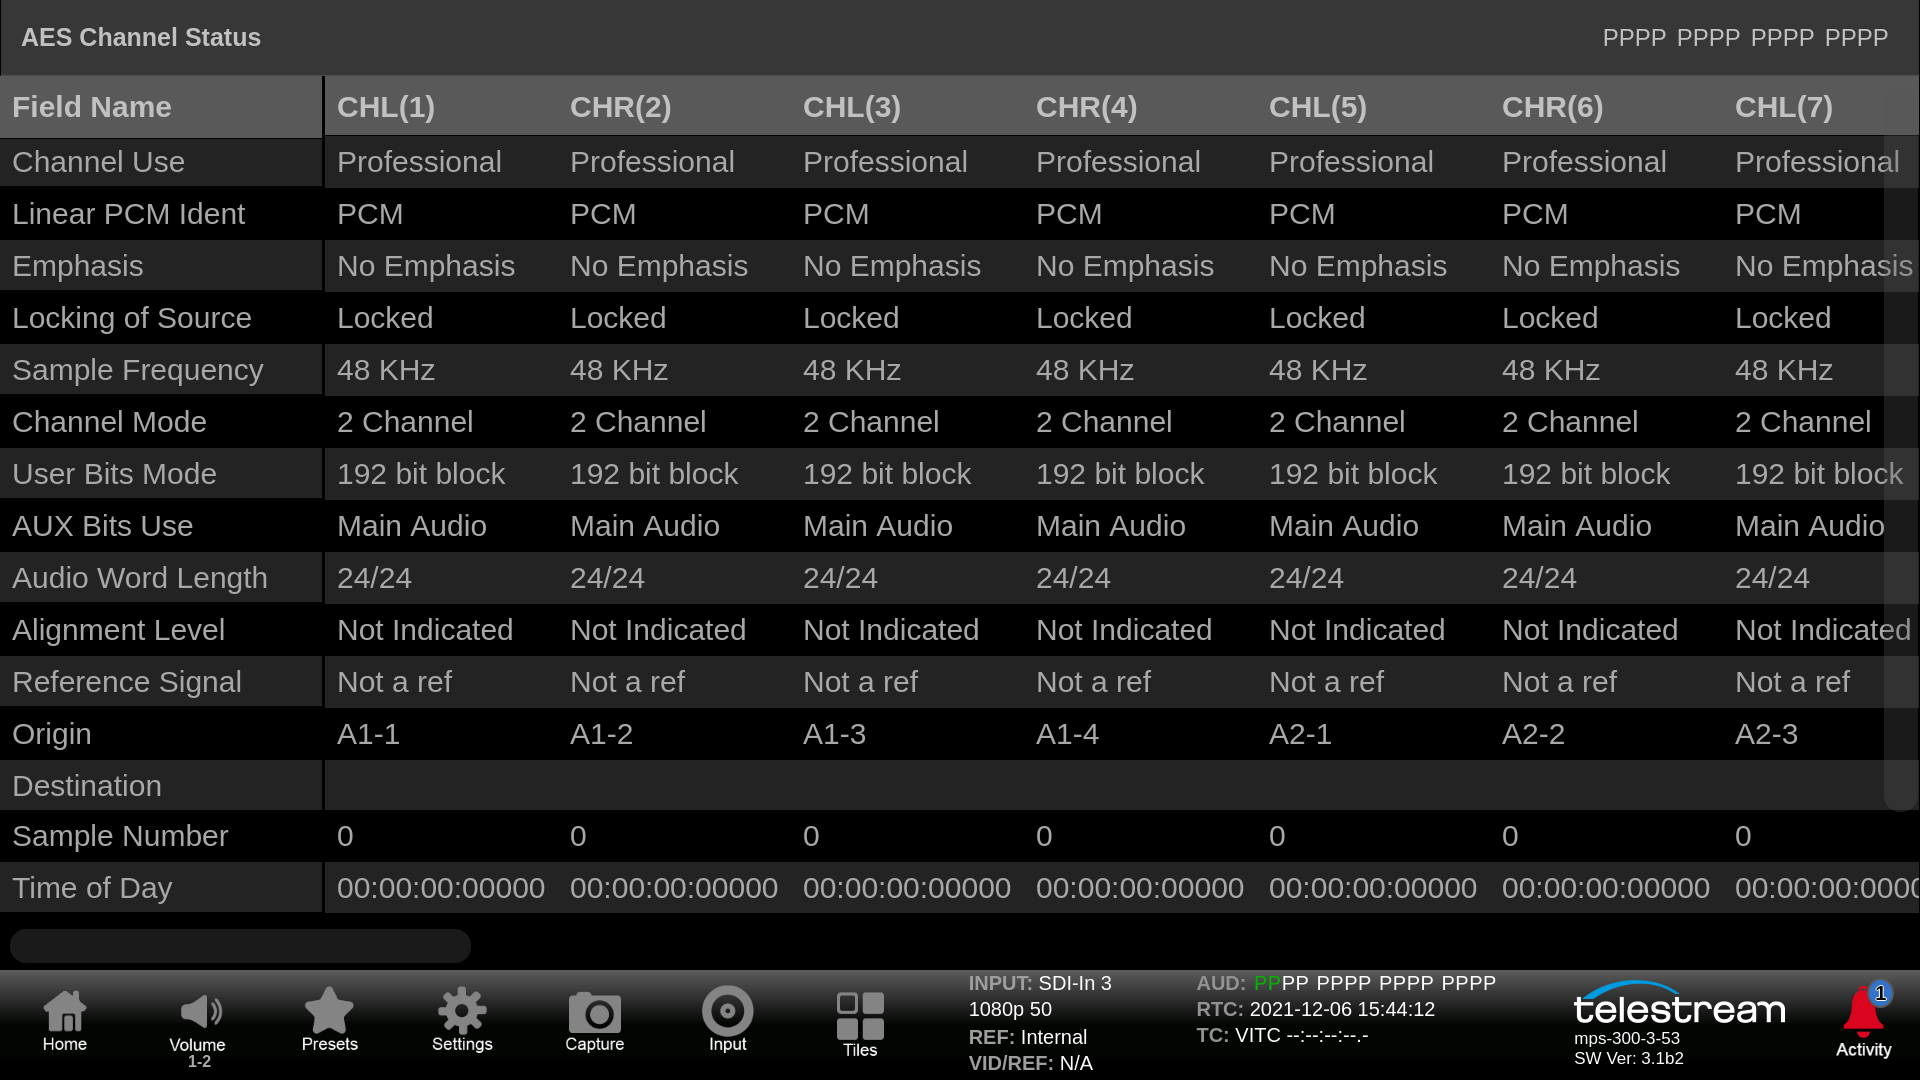
When the Channel Use mode of Professional is used the instrument automatically decodes the syntax as shown above.
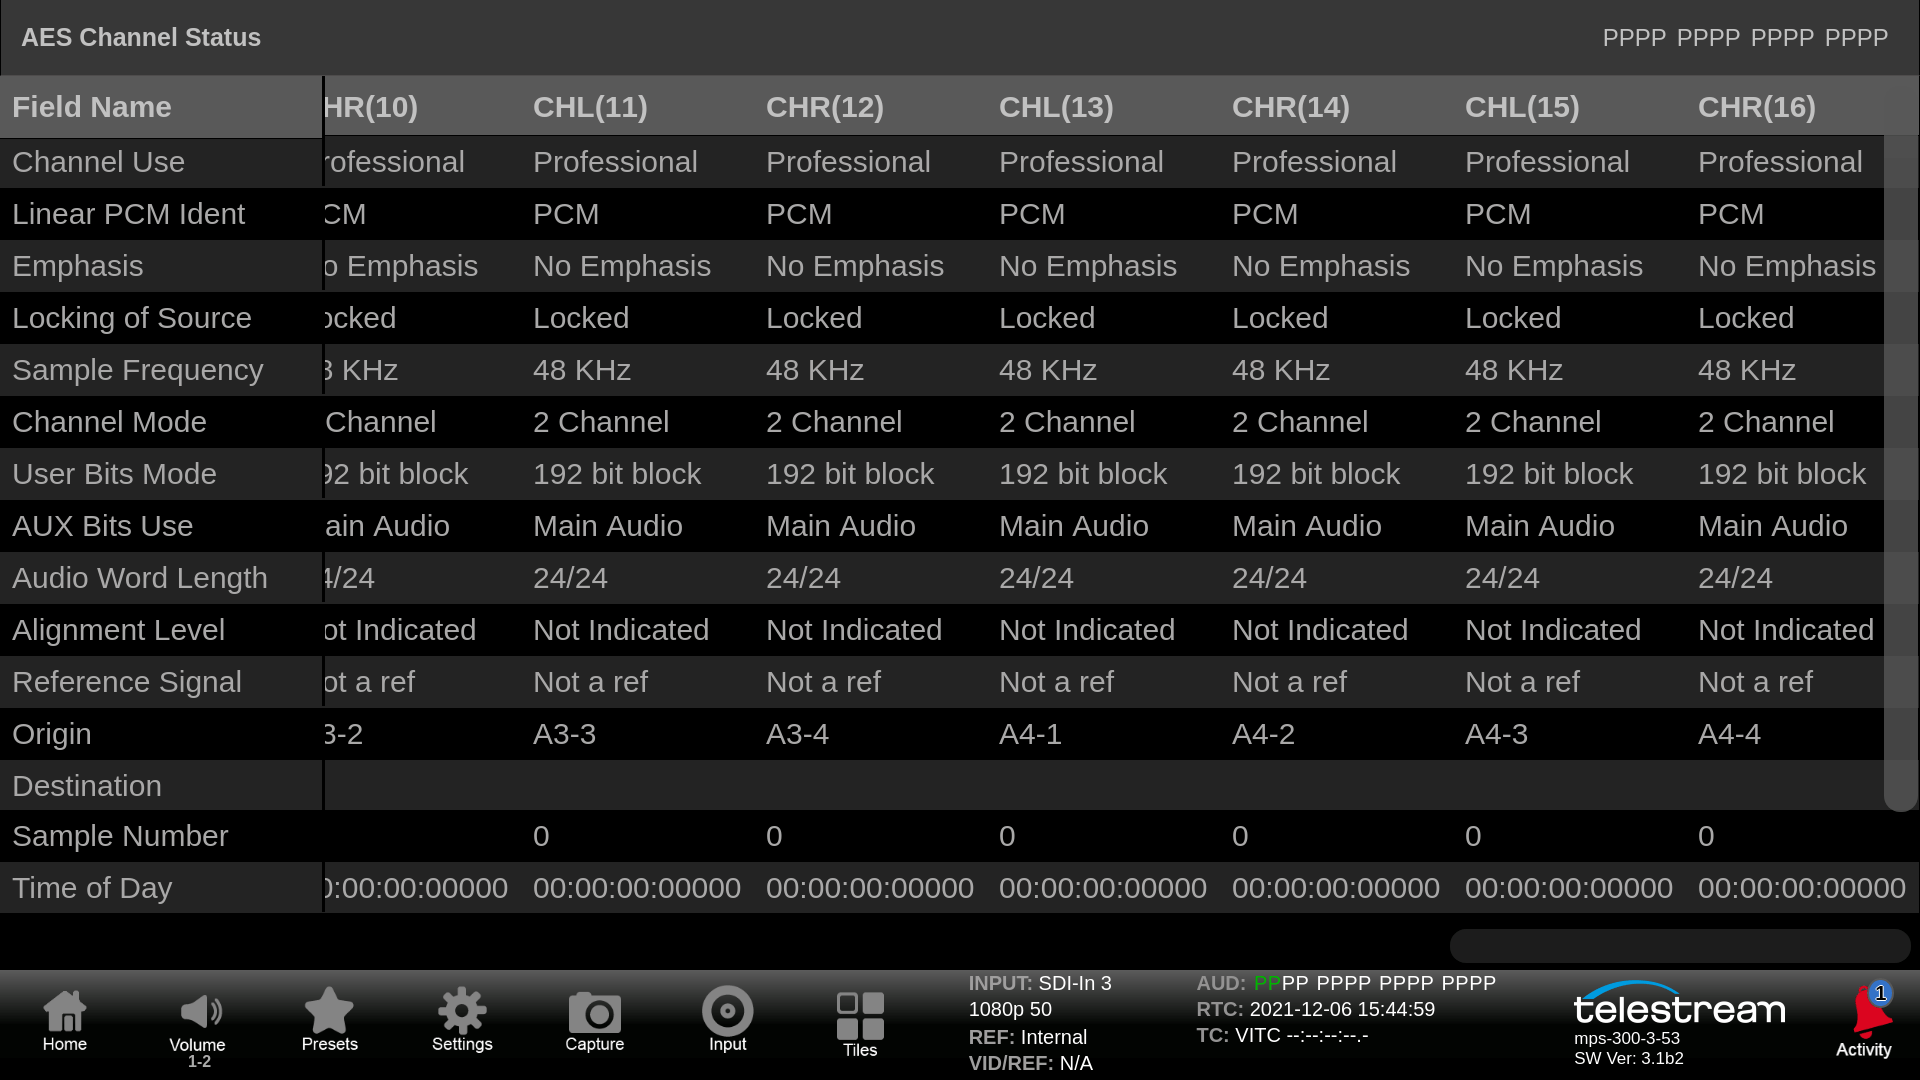
Scrolling horizontally allows the user to see and compare the various embedded audio groups for each of the audio signals present. AES Channel status provides syntax information for parameters such as Emphasis, Locking of Source, Sampling Frequency, Channel Mode and Audio Word Length.
Using the flexible display configurations within PRISM a two-tile display each configured with AES Channel Status displays allows the user to scroll through the syntax information group by group. Allowing the user to easily compare AES Channel Status information for each group that can aid in troubleshooting issues.
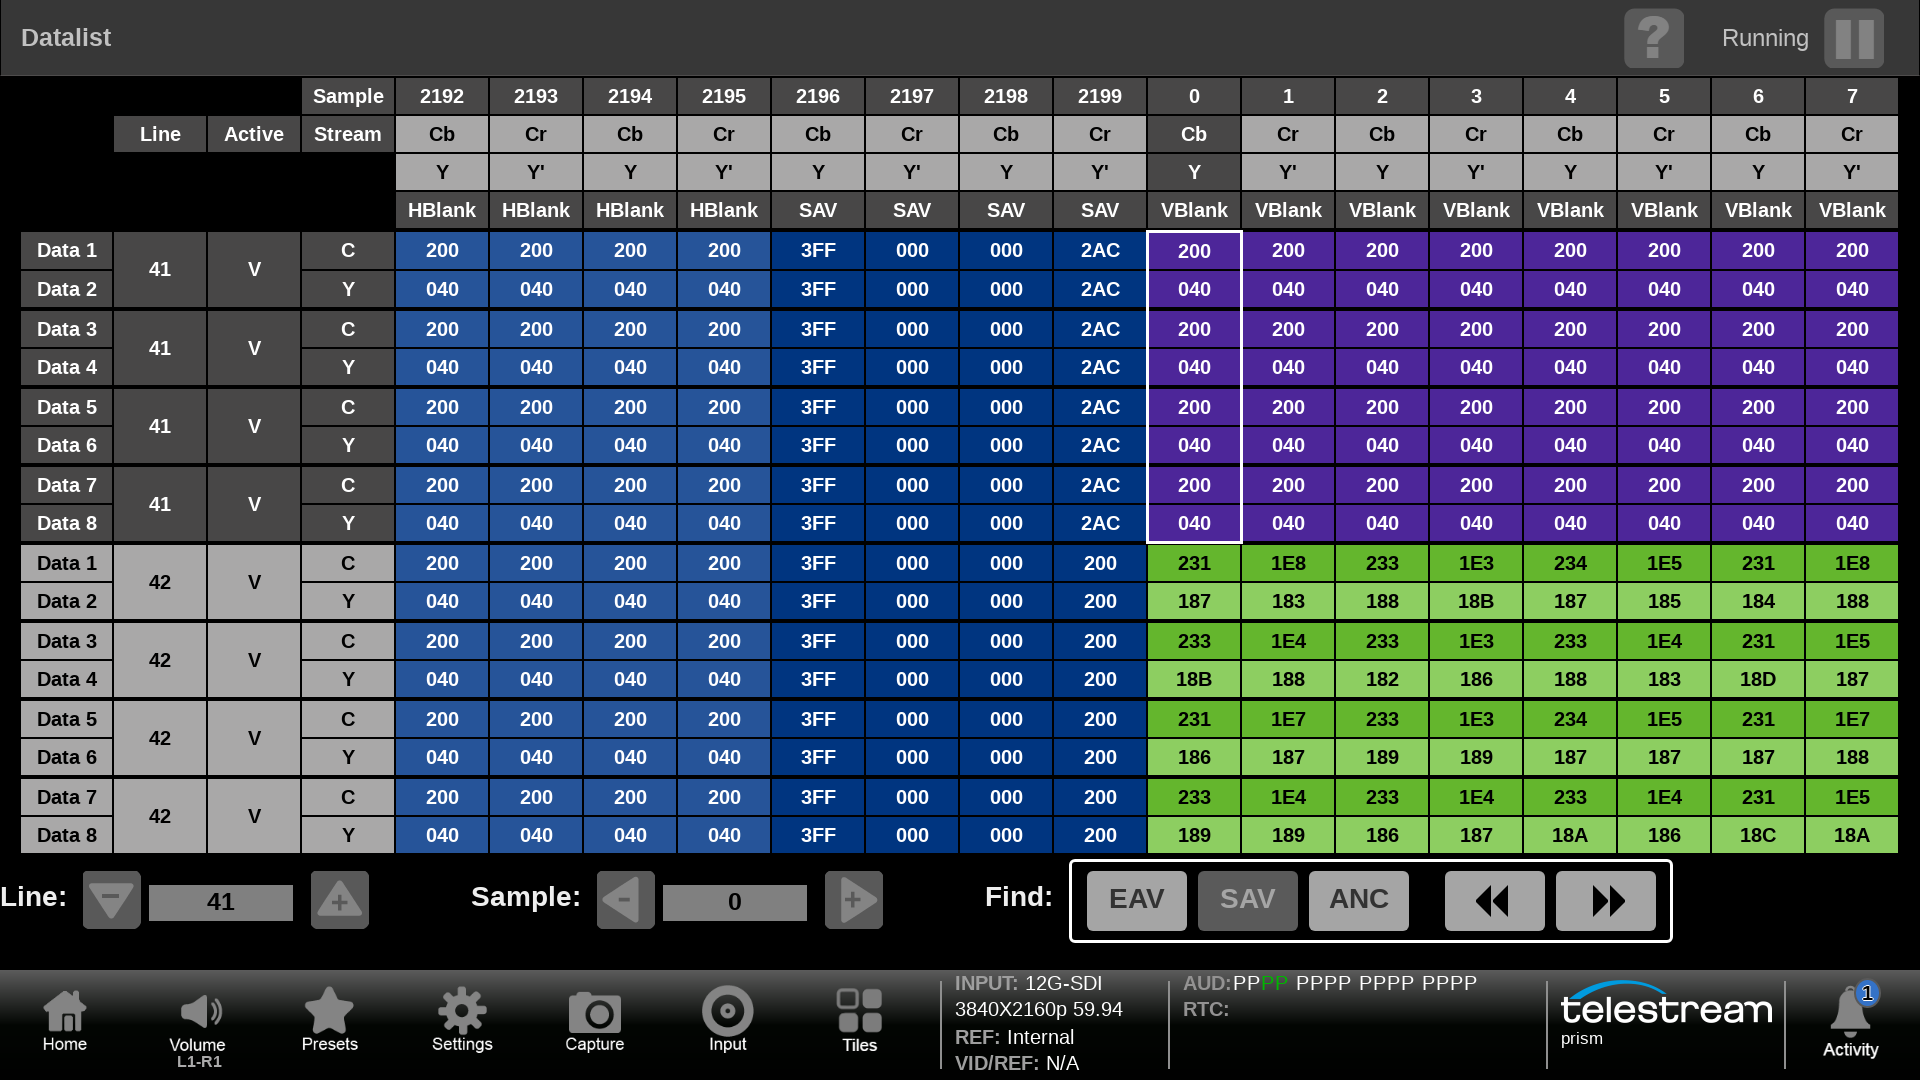
Datalist
Datalist display can be used to view the samples of the SDI signals. The user can search through the data for Start of Active Video (SAV) or End of Active Video (EAV) or the next ANC Data packet. Option ENG-QC is required for this application.
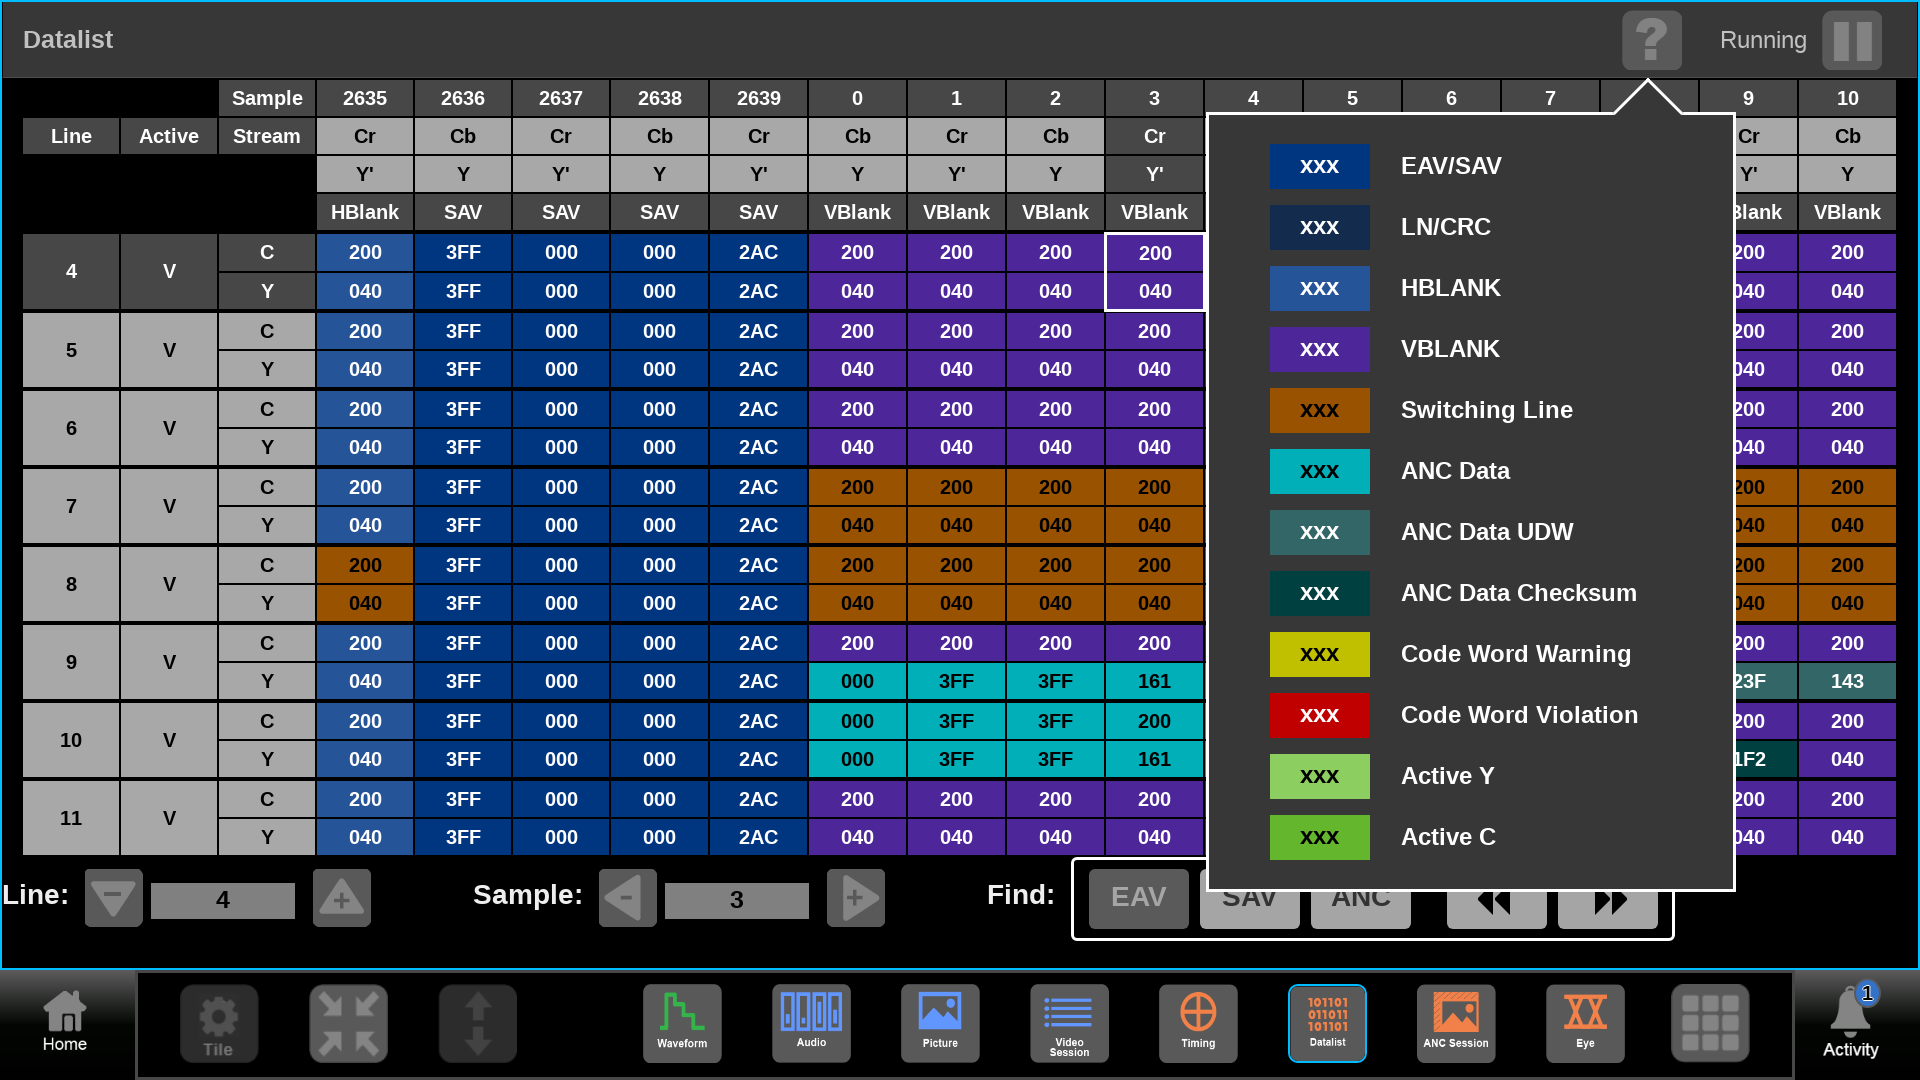
Selecting the question mark within the Datalist display shows the color code legend used to identify certain types of data. For instance the switching line is indicated in brown.
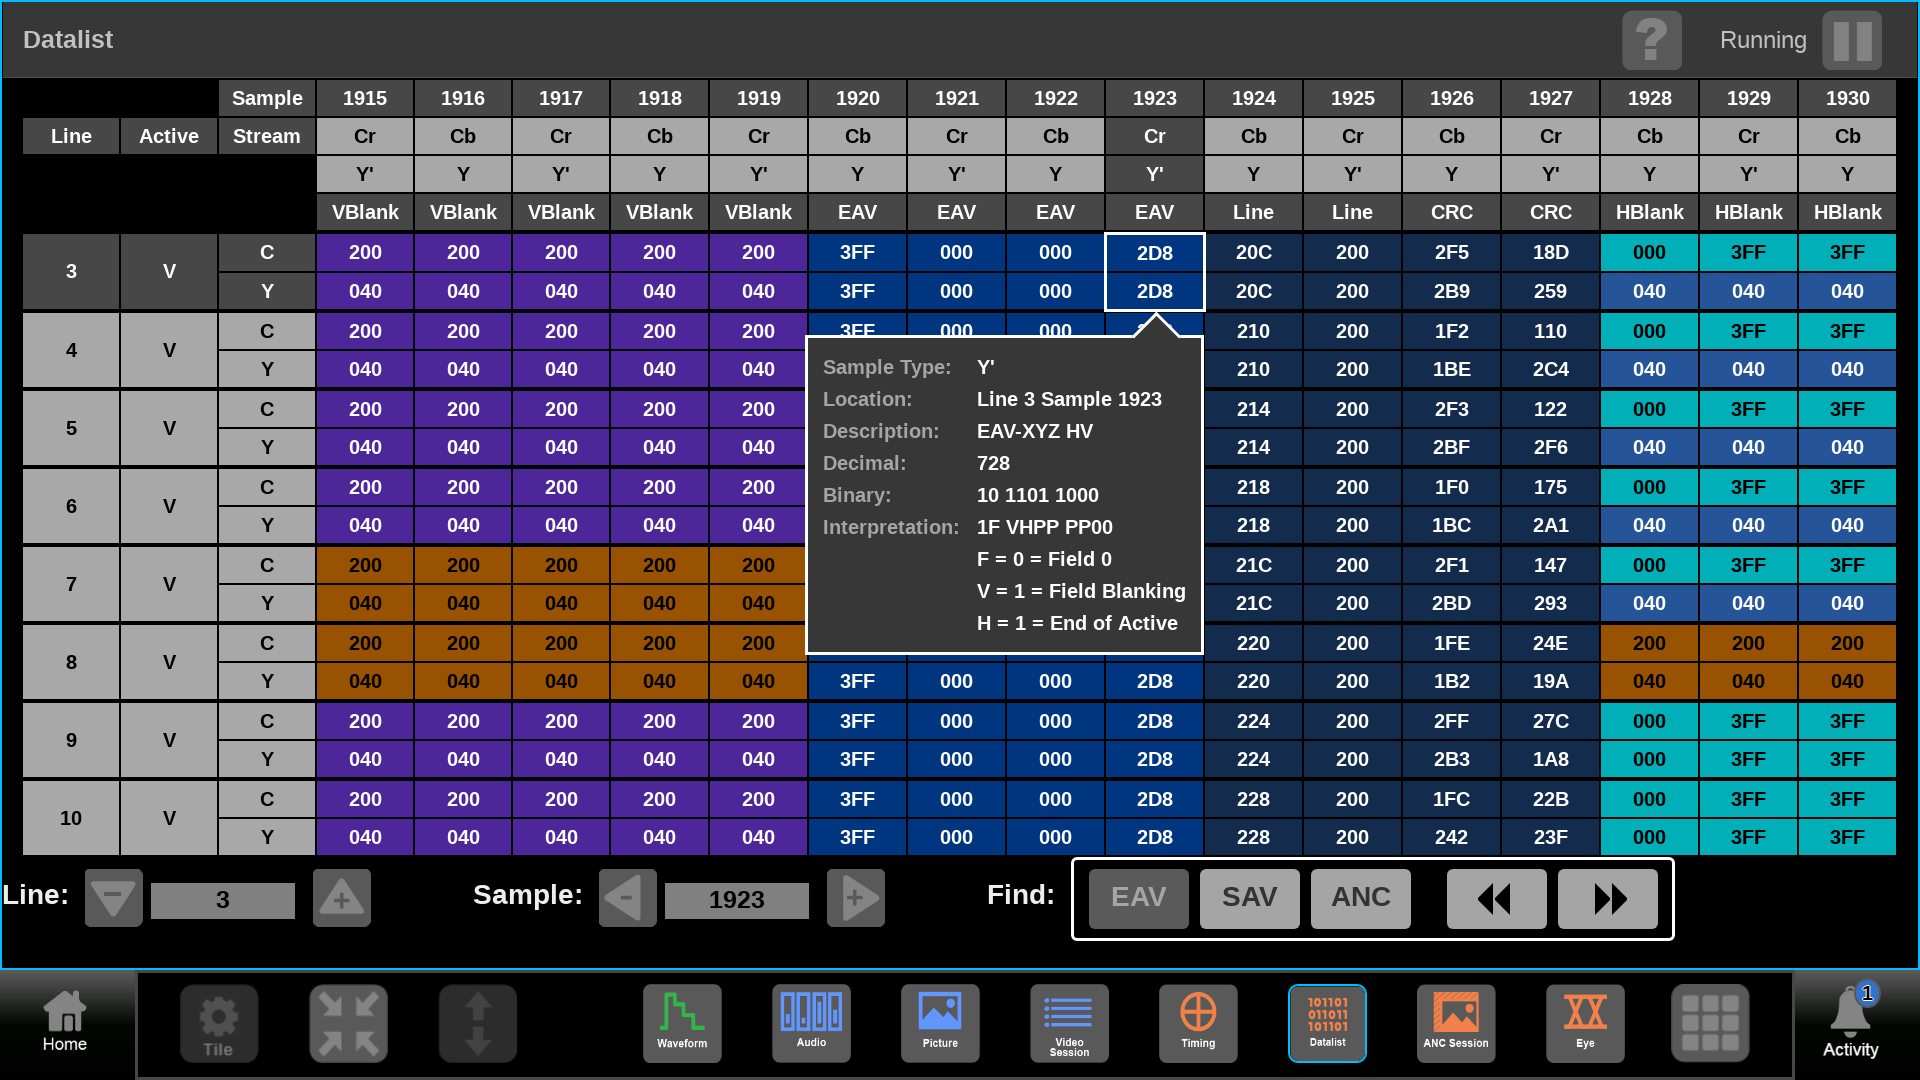
The user can search through the data by line and sample location or use the Find function to search for EAV, SAV or ANC within the signal. Simple pressing the sample will provide a tooltip interpretation of the data.
In this case a 12G signal has been applied to PRISM and shows each of the eight virtual streams. Line 41 was selected, and a search was performed to find the Start of Active Video (SAV).
ANC Session
ANC Session provides a Watchlist of the available Ancillary Data types present within the signal. Option ENG-QC is required for this application.
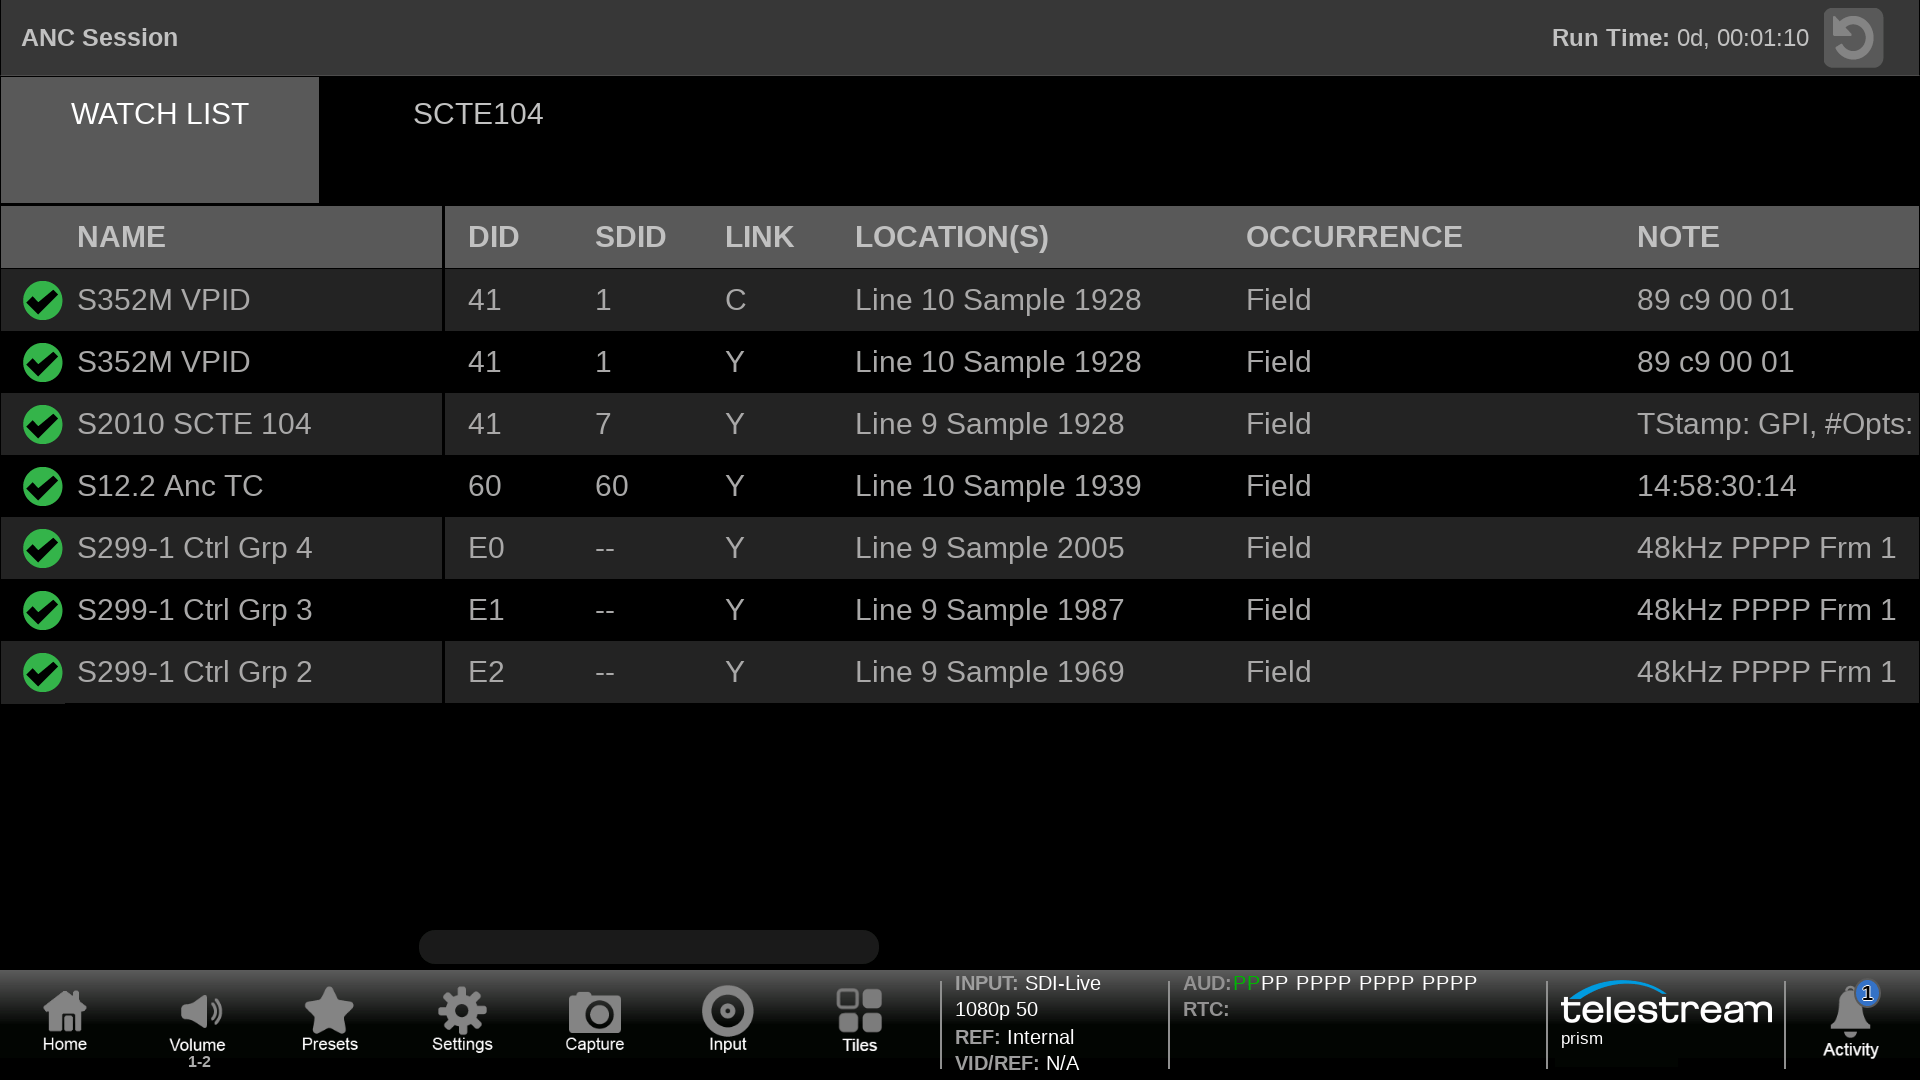
The ANC Session Watchlist provide a list of the ANC data packets including TTML over ST2110-43 that are present within the signal showing the DID, SDID, Location and Occurrence within the frame or field. Notes provides additional information on the syntax of the packet.
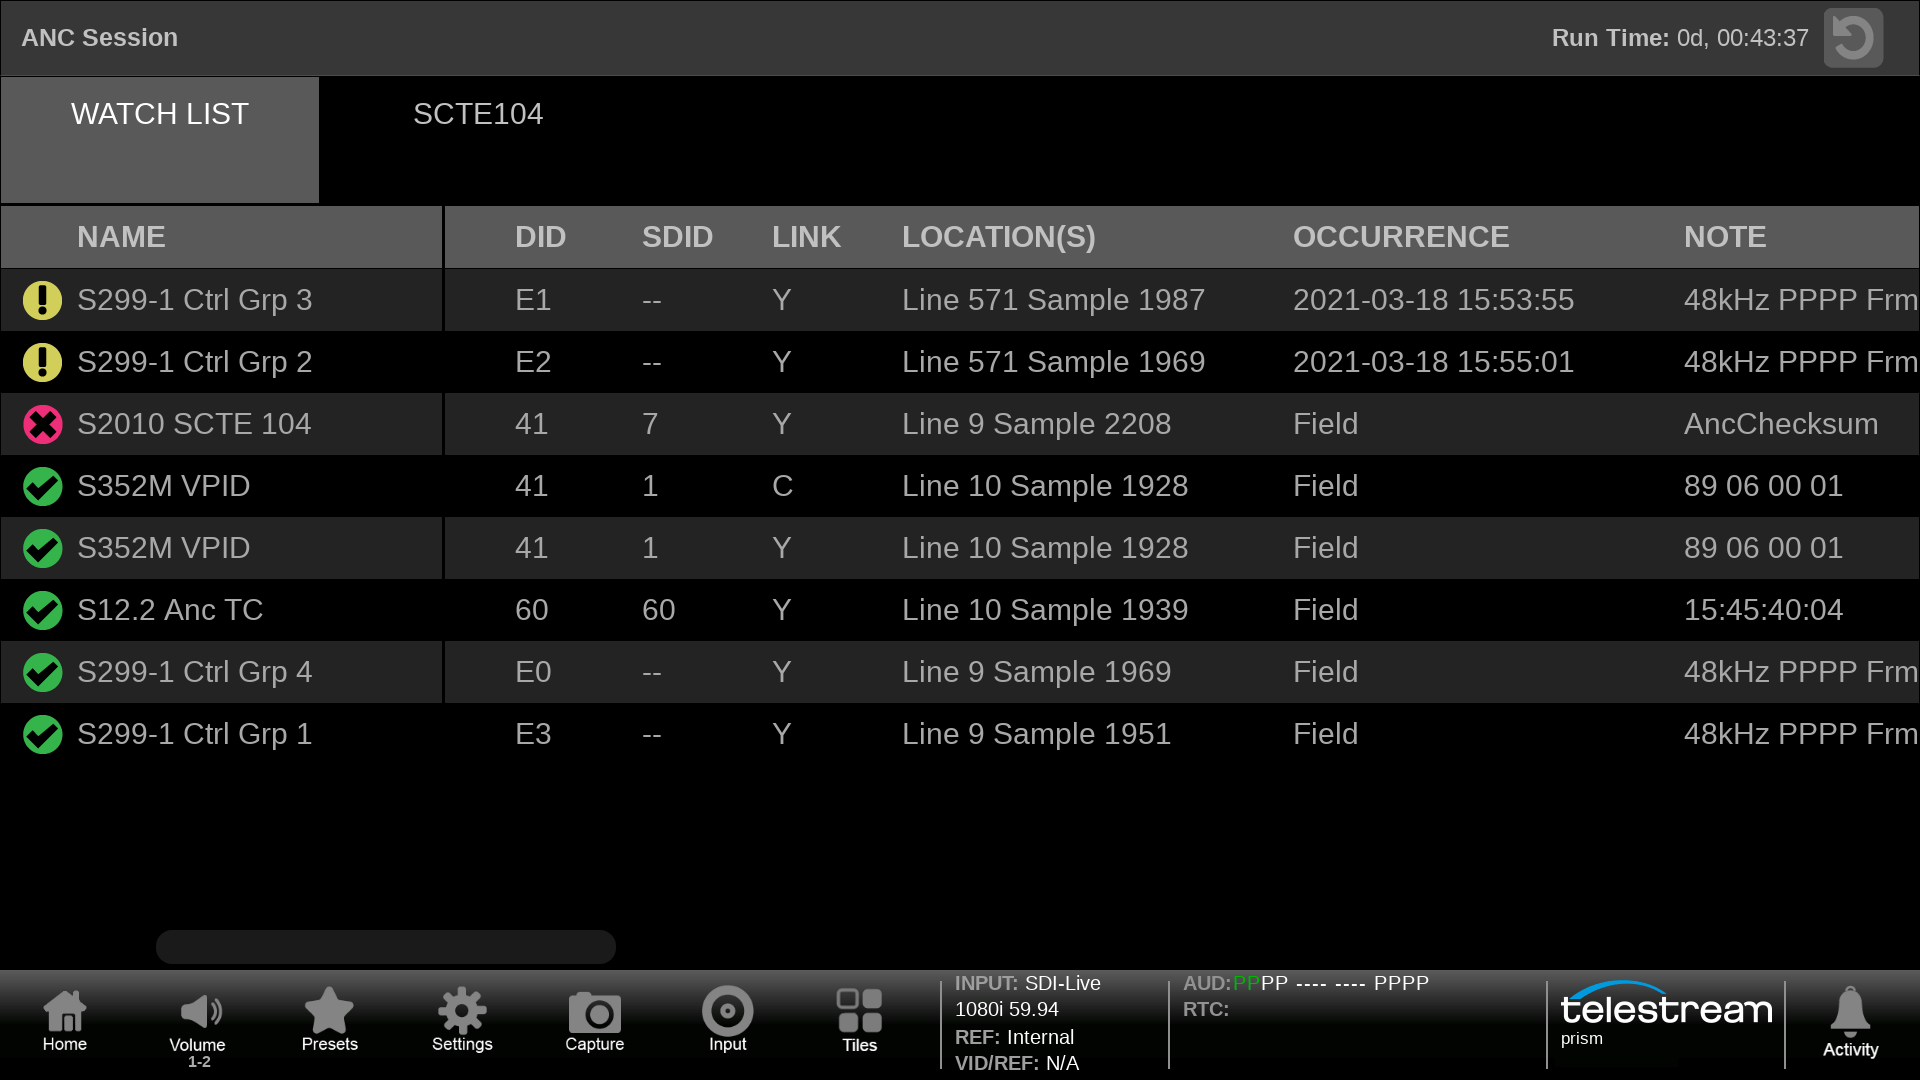
Simple indicators (Red, Yellow, Green) can be used to identify issues within the ANC packets. Green indicates ANC packet is present and valid. Yellow indicates that the ANC packet was present and shows the last occurrence. Red indicates an error.
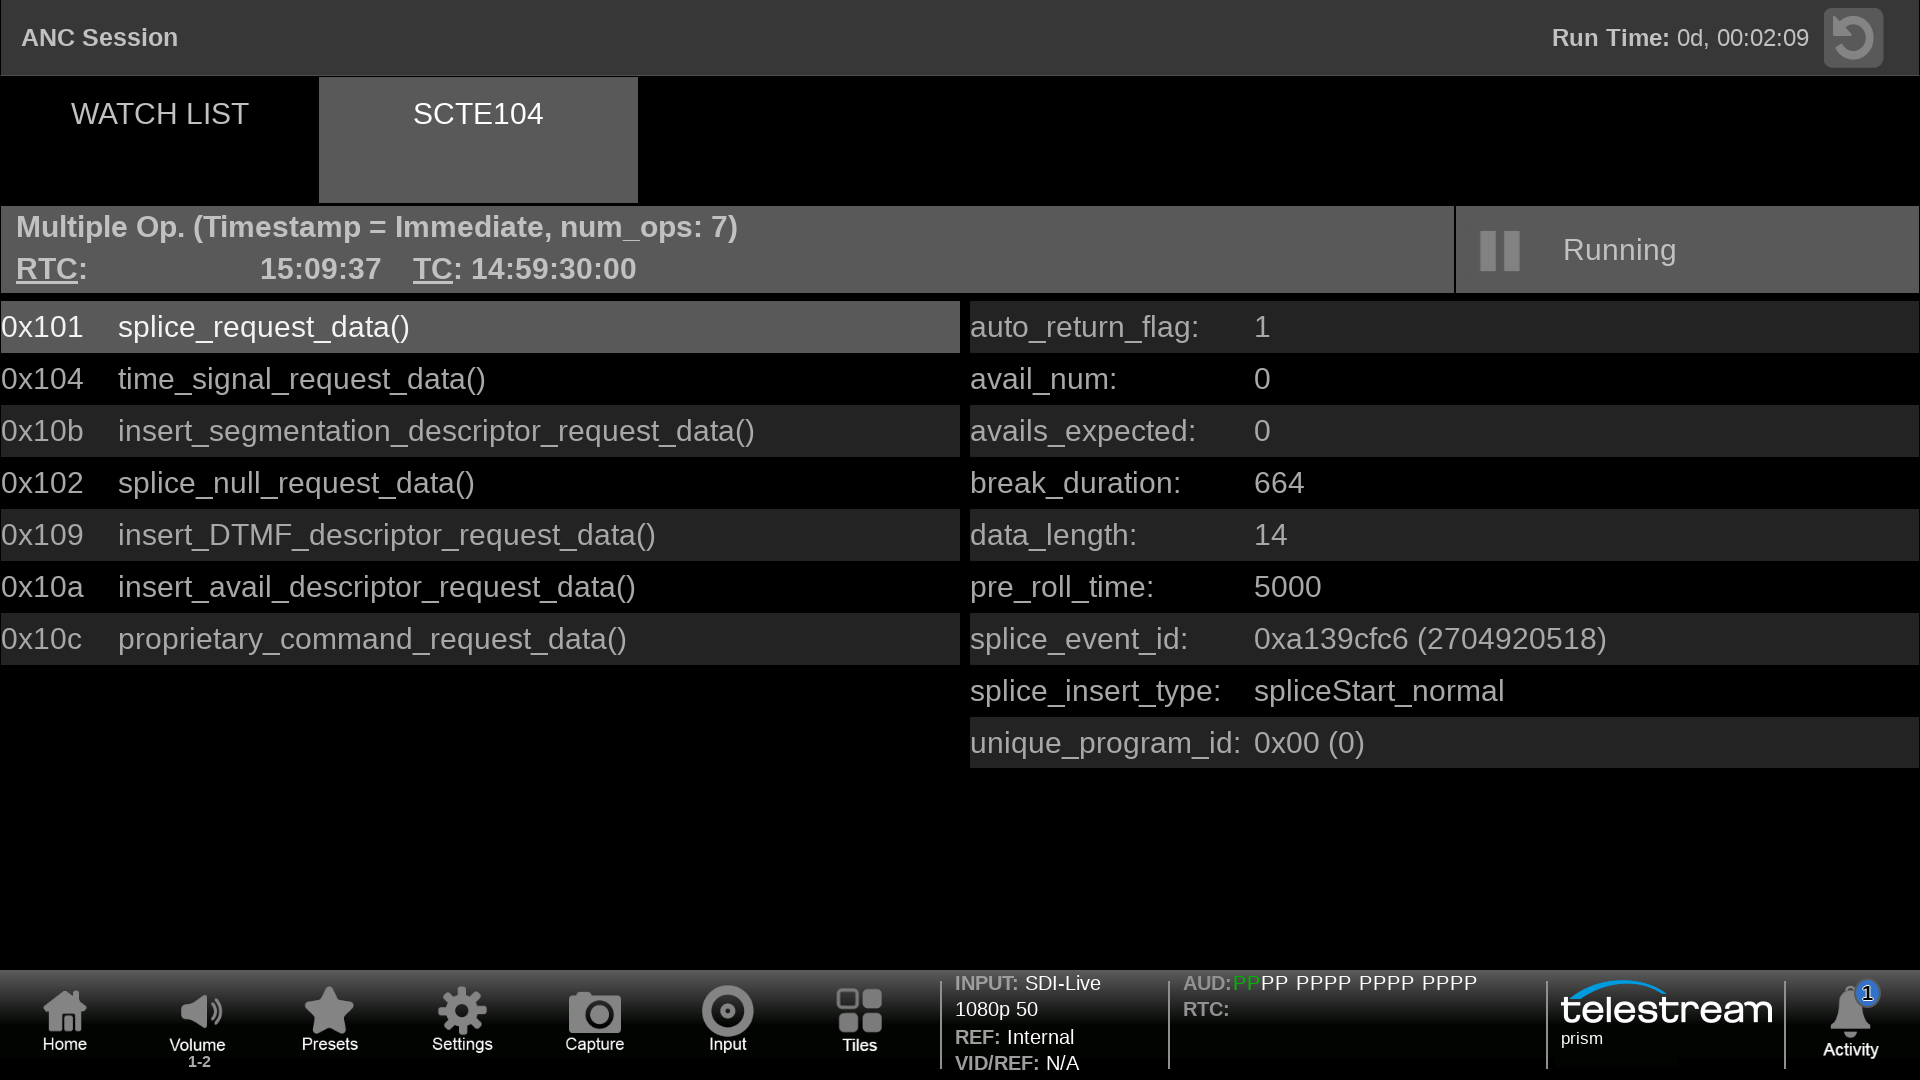
SCTE 104 messaging provides a method to indicate when a splice point should occur within the program. This information is carried within an ANC packet with DID 41 & SDID 07. The SCTE 104 tab shows interpretation of the User Data Words.
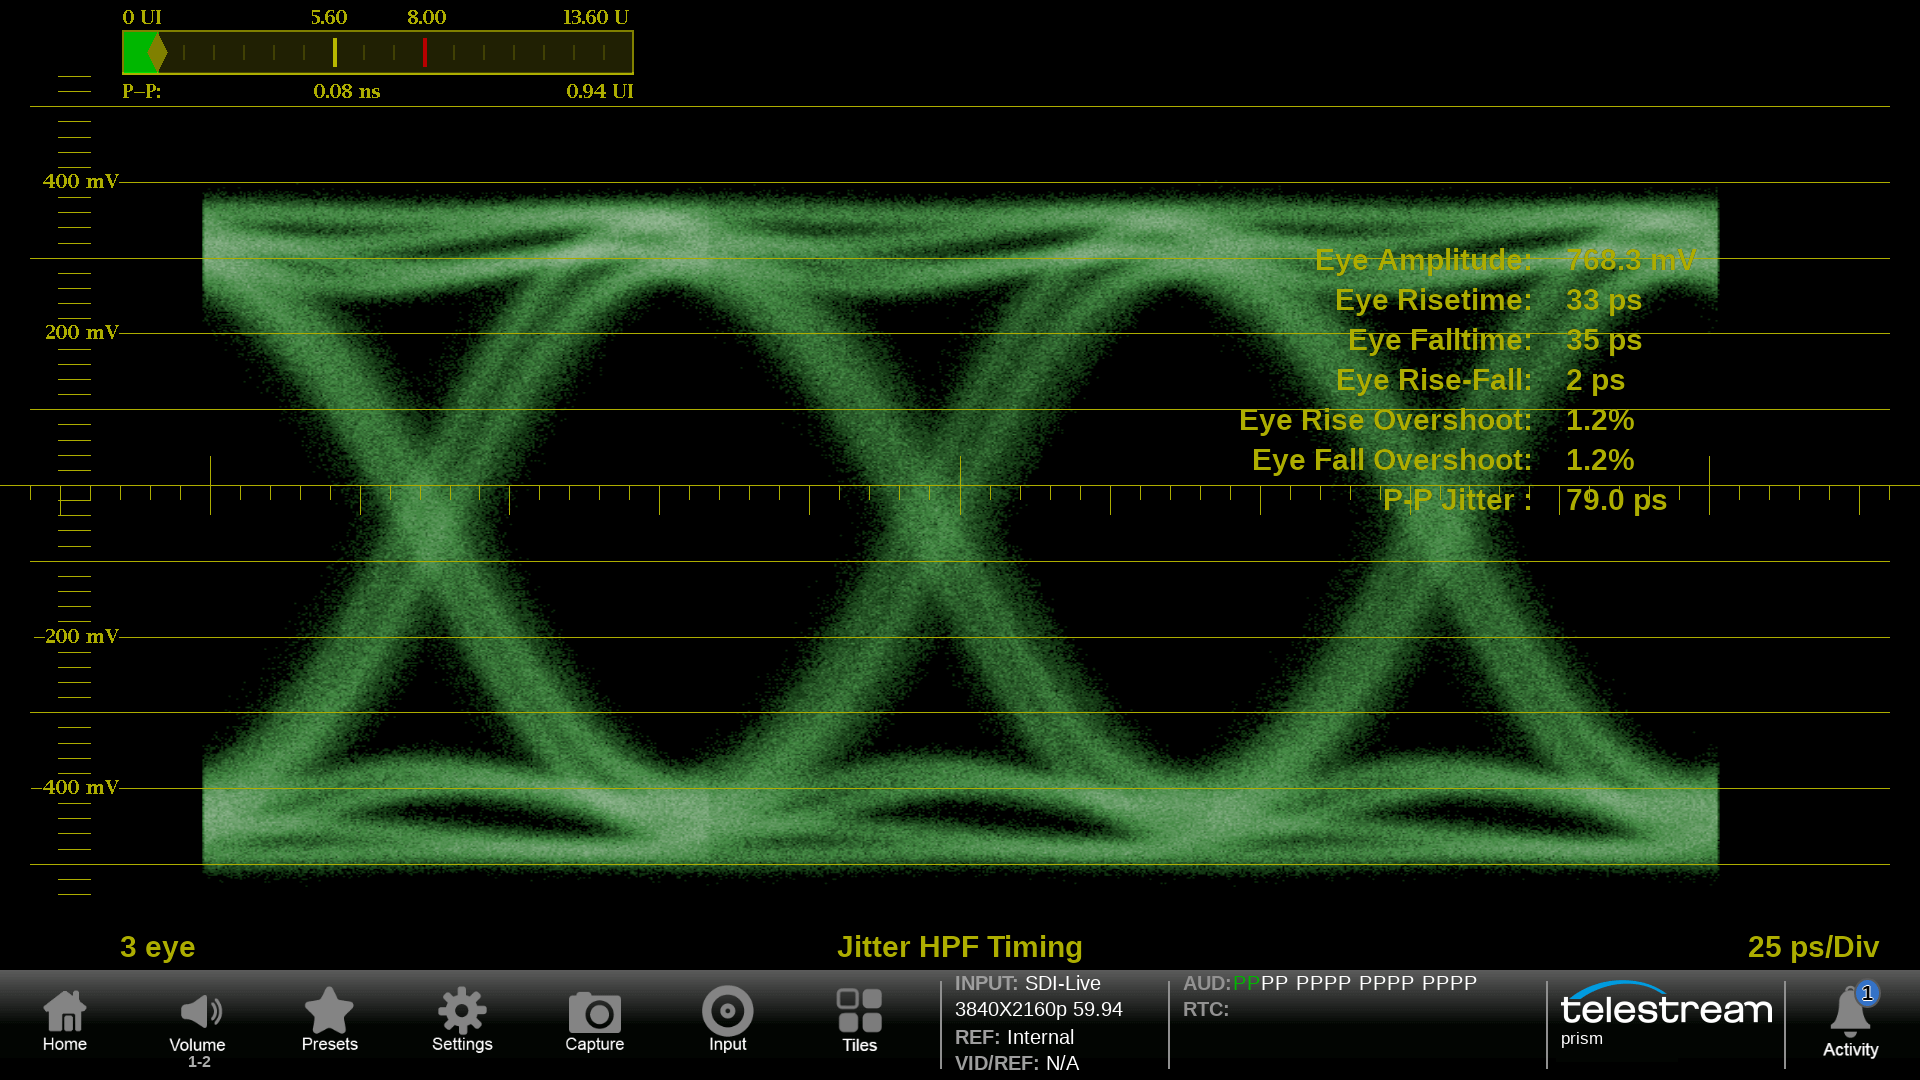
Eye Display
The Eye Display provides a measurement of the SDI physical layer for Timing and Alignment with automated measurements. The Eye Display feature is available in MPS300, MPD300 and MPP300 as standard. Option FMT-4K to enable the support for 6G and 12G SDI.
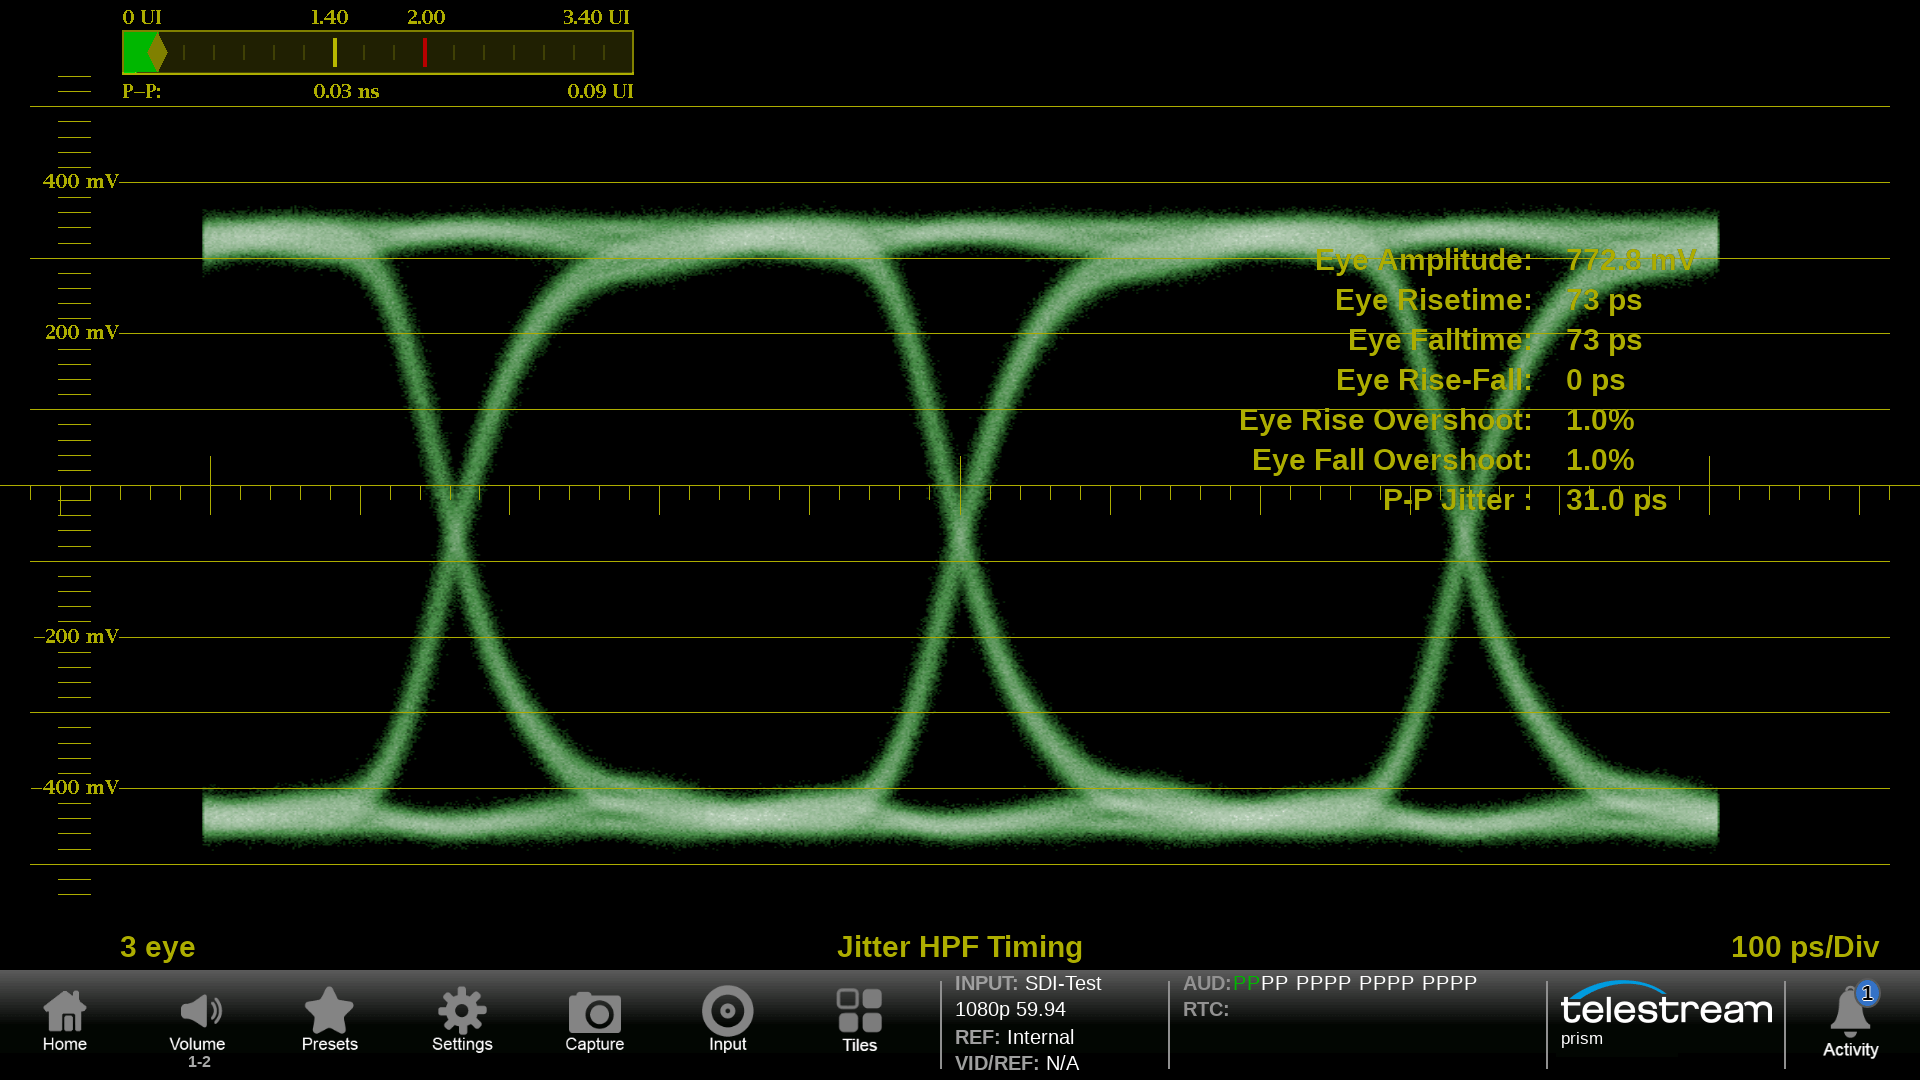
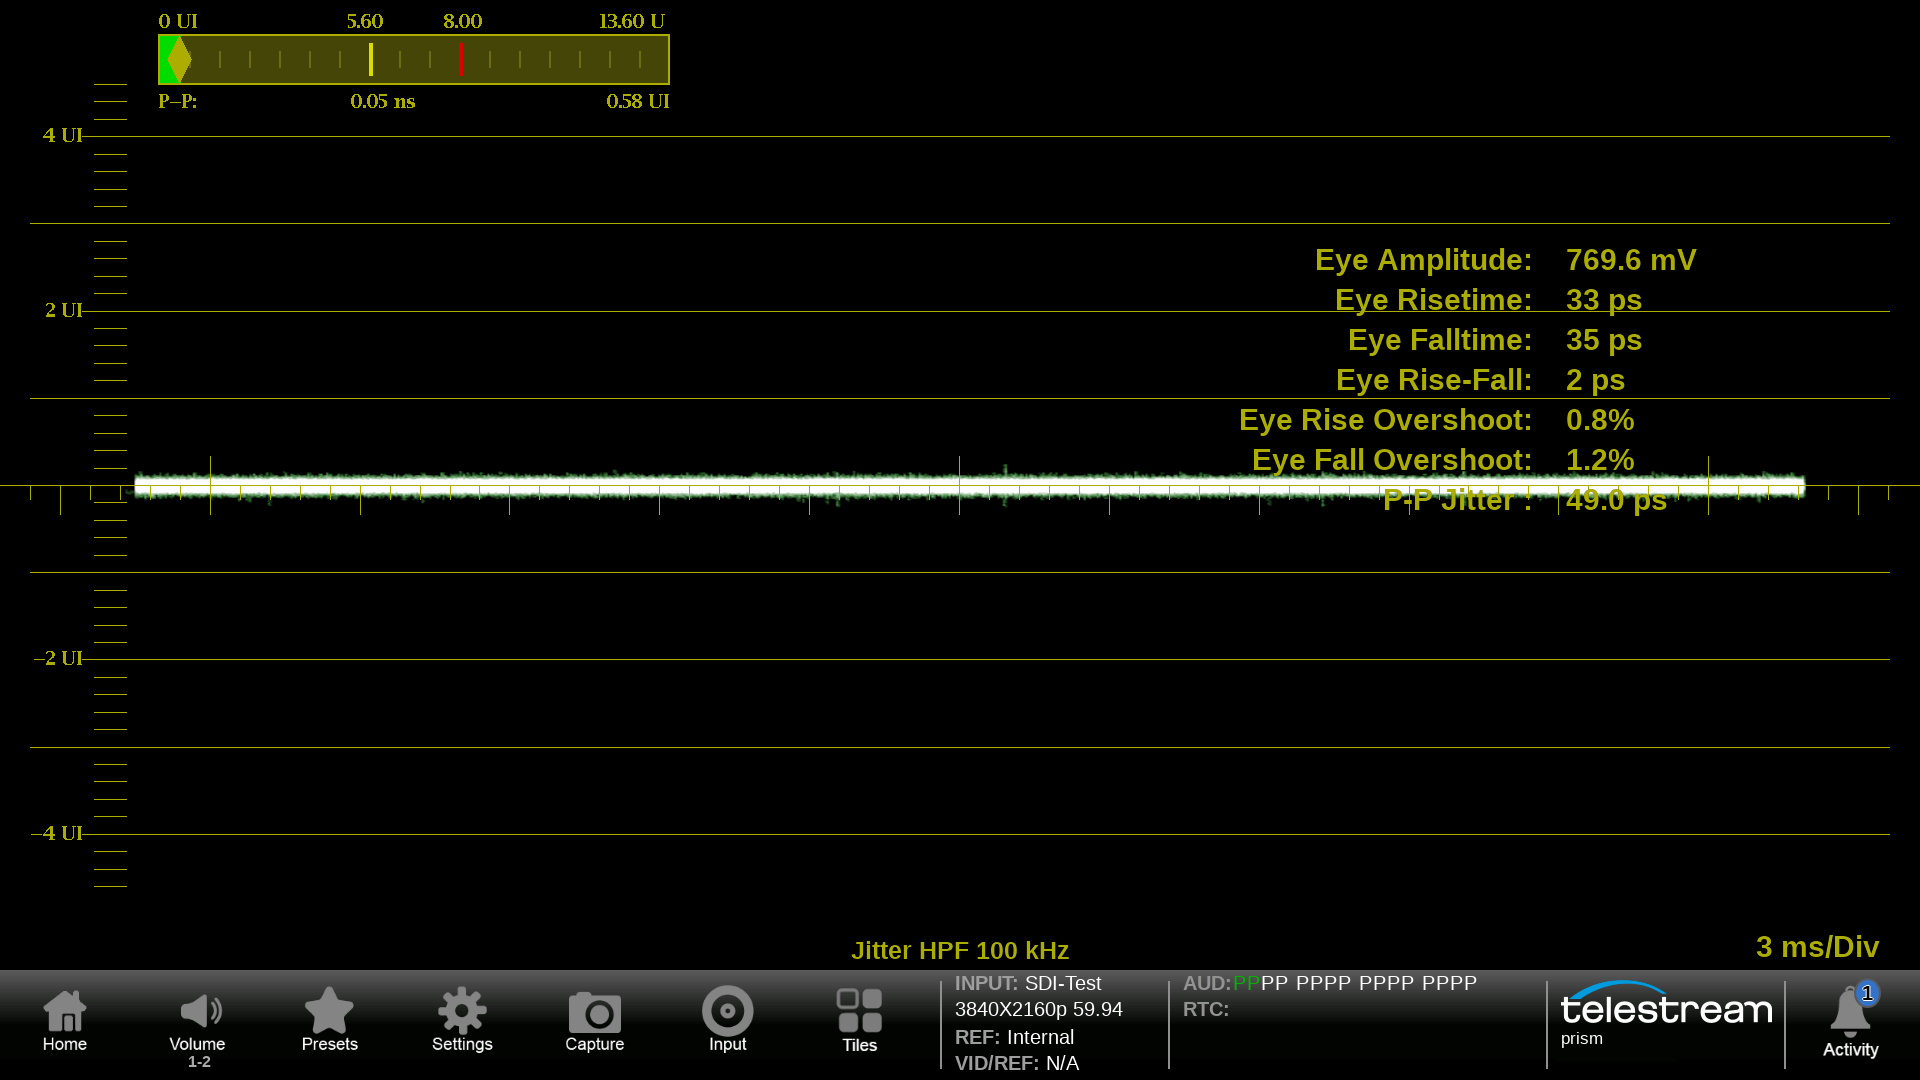
A 3 Eye display with a 3G SDI test signal applied to PRISM. With Automated Eye measurements of eye amplitude, rise/fall time and overshoot. The peak to peak jitter measurement is also shown with a simple Jitter meter display.
A 3 Eye display with a 12G SDI signal from a router output to Prism. The engineer can selectively choose a filter from 10Hz to 100kHz. In this case a 10Hz (Timing) filter has been applied to the signal.
A 3G SDI Pathological signal has been applied to the system and PRISM shows a two field sweep of the eye pattern for this signal.
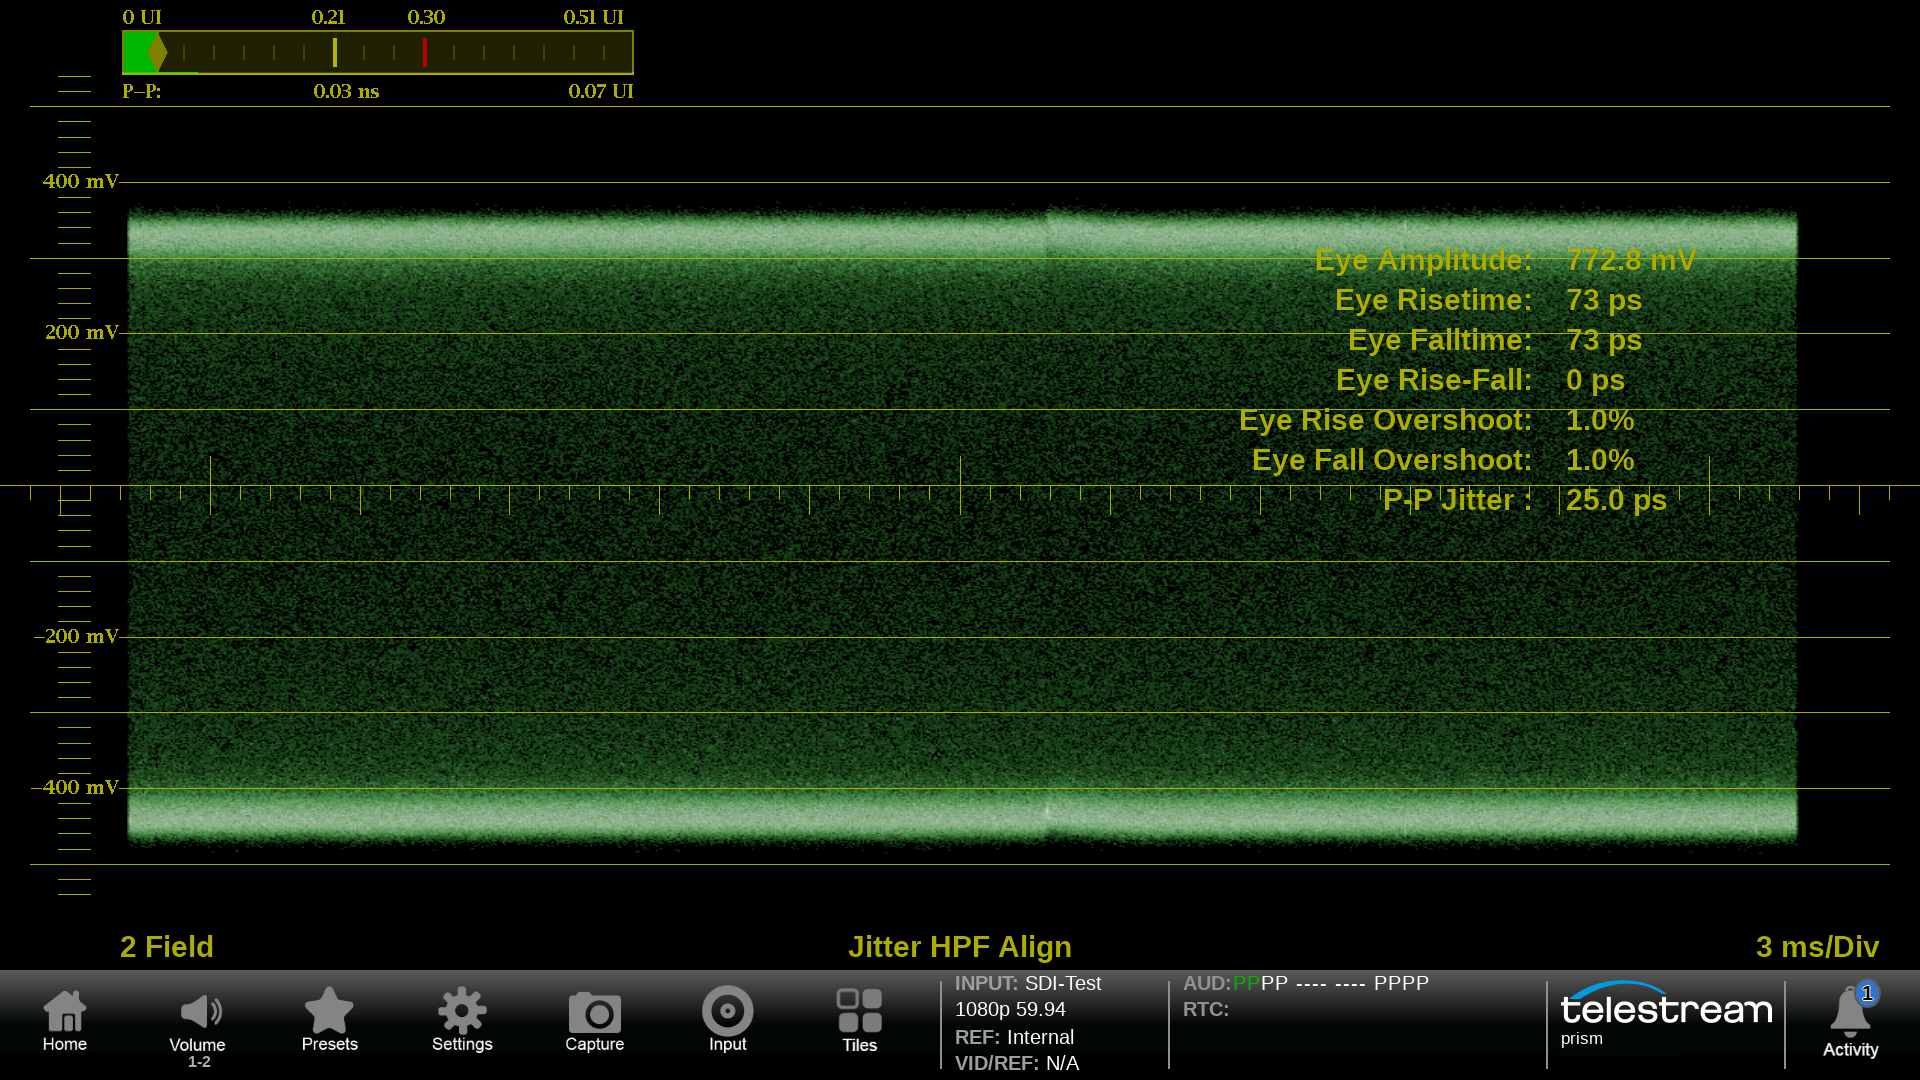
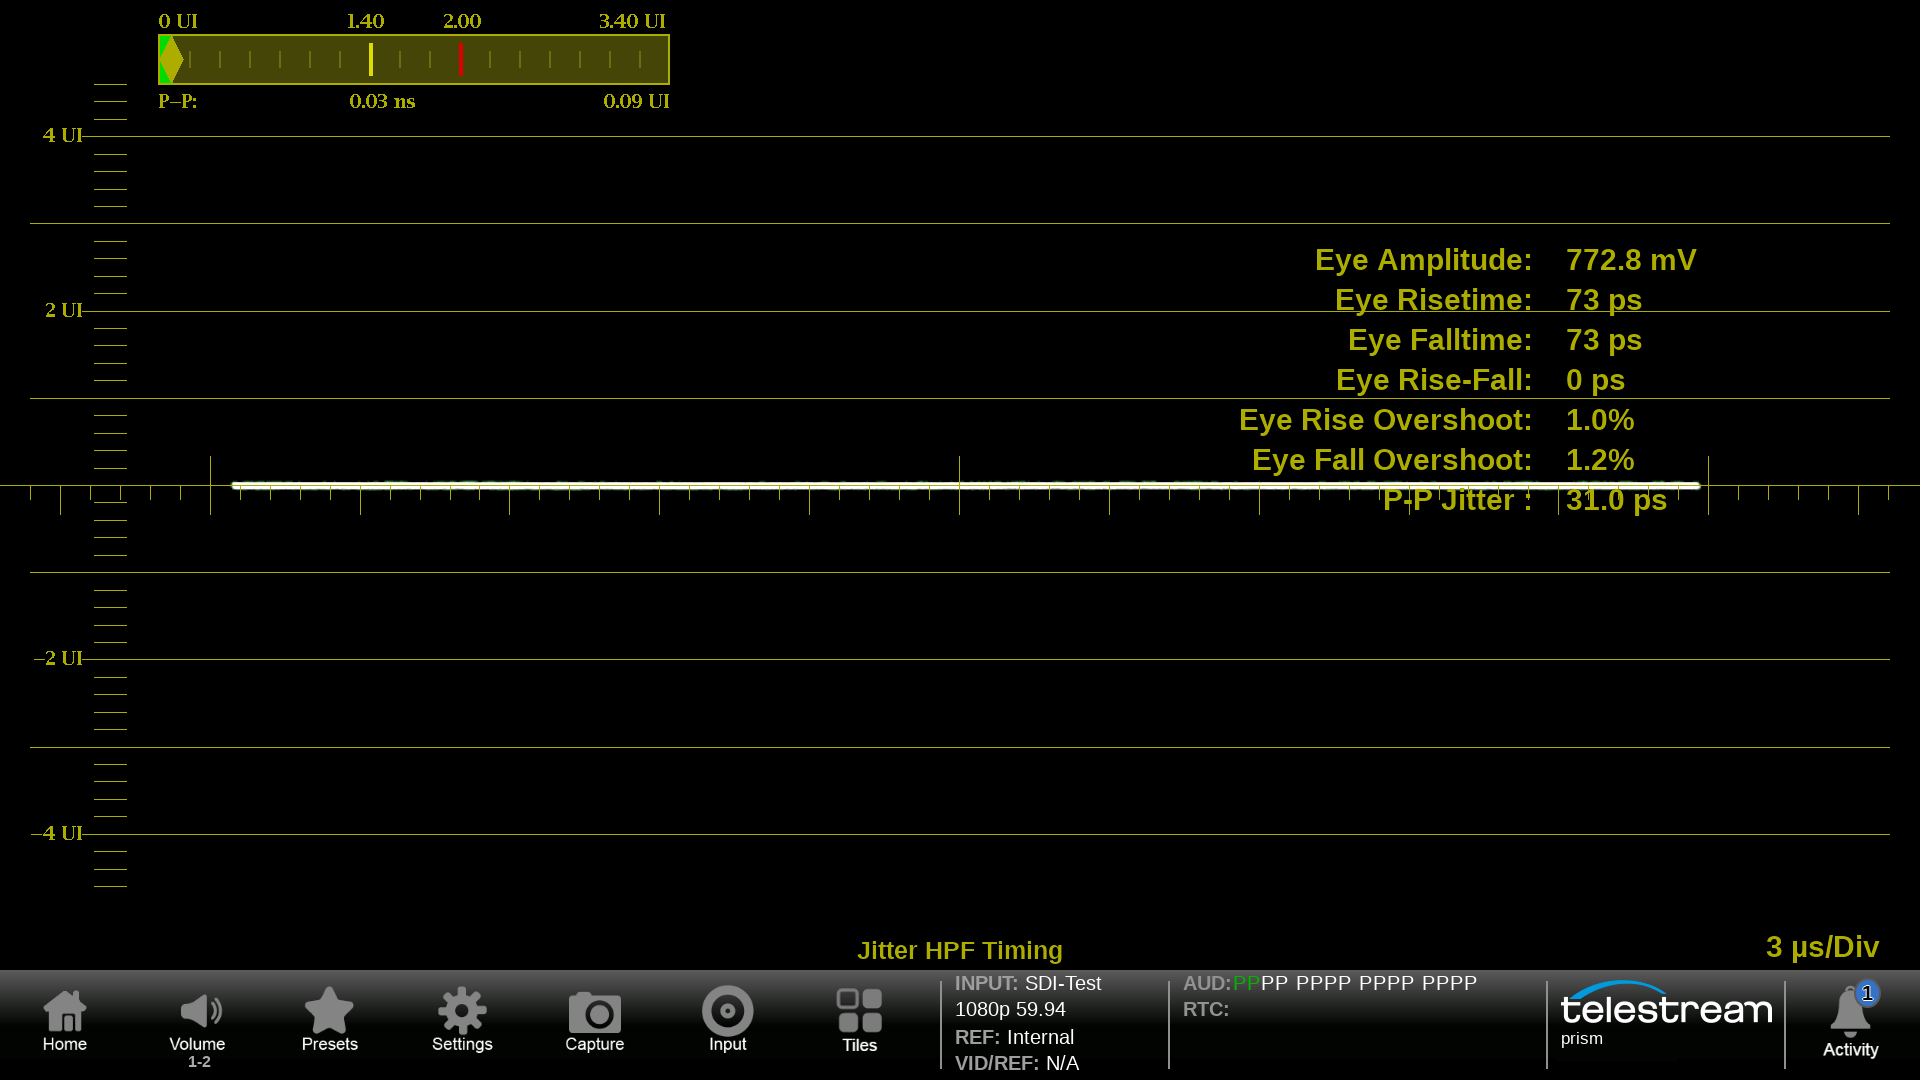
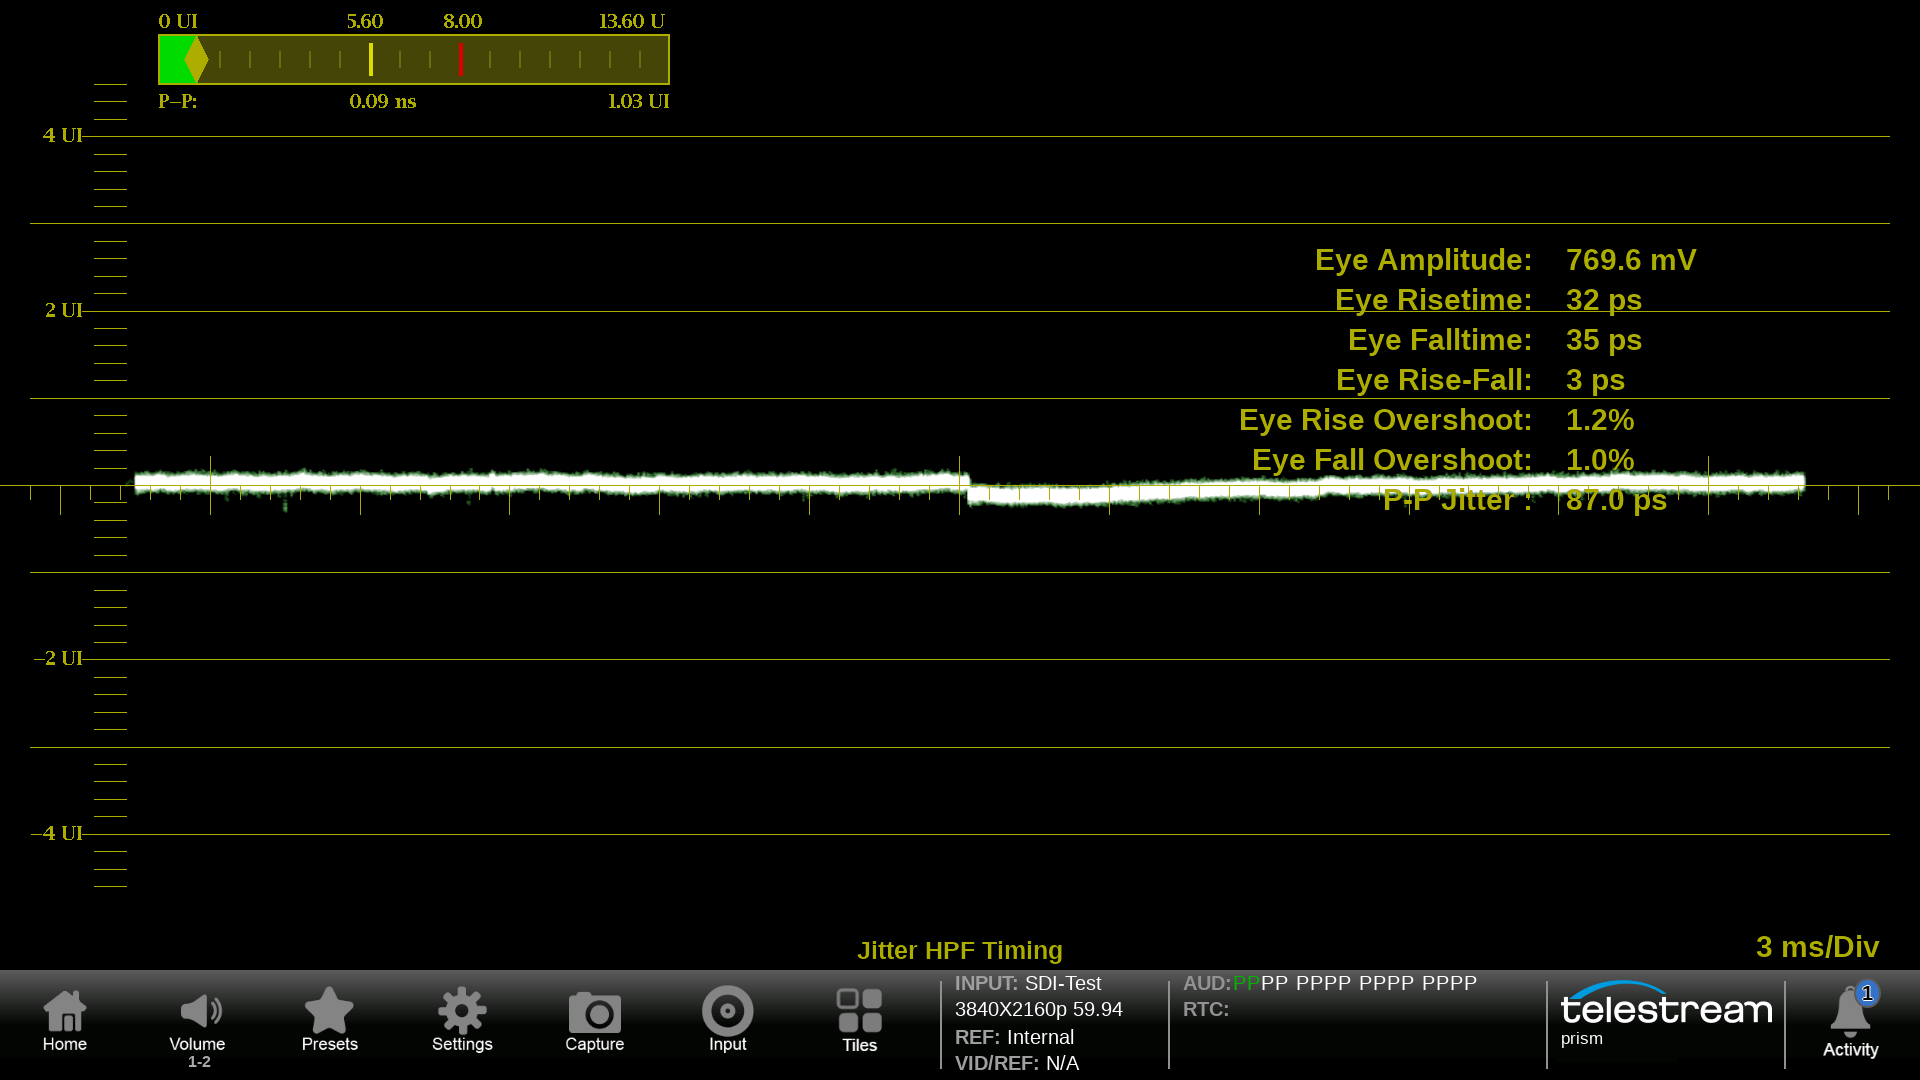
Jitter Display
The Jitter Display can be used in conjunction with the Eye display to measure the physical layer of the SDI signal. The Jitter Display feature is available in MPS300, MPD300 and MPP300 as standard. Option FMT-4K to enable the support for 6G and 12G SDI.
A 3G SDI signal has been applied to PRISM from a test signal source and the resulting 2 line jitter display is shown. The 10Hz Timing filter has been applied and the resulting automated peak to peak jitter is shown.
Various filters can be applied from 10Hz to 100kHz to assess which bandwidths the jitter is present within. Timing jitter uses the 10Hz filter while Alignment jitter uses the 100kHz filter. In this case the Timing jitter filter is applied and the peak to peak jitter value can be measured.
In this case the 100kHz Alignment filter has been applied to the same 12G SDI signal and the resulting peak to peak jitter measurement can be obtained.
AV Delay
AV Delay measurement measures the presentation time difference of audio and video with AV Timing mode test signal (Flash & Pop) generated by Telestream Sync Pulse Generator products. The user can measure lip sync timing of PCM / Dolby over SDI, ST 2110 and ST 2022-6 signals. Option ENG-QC is required for this application.
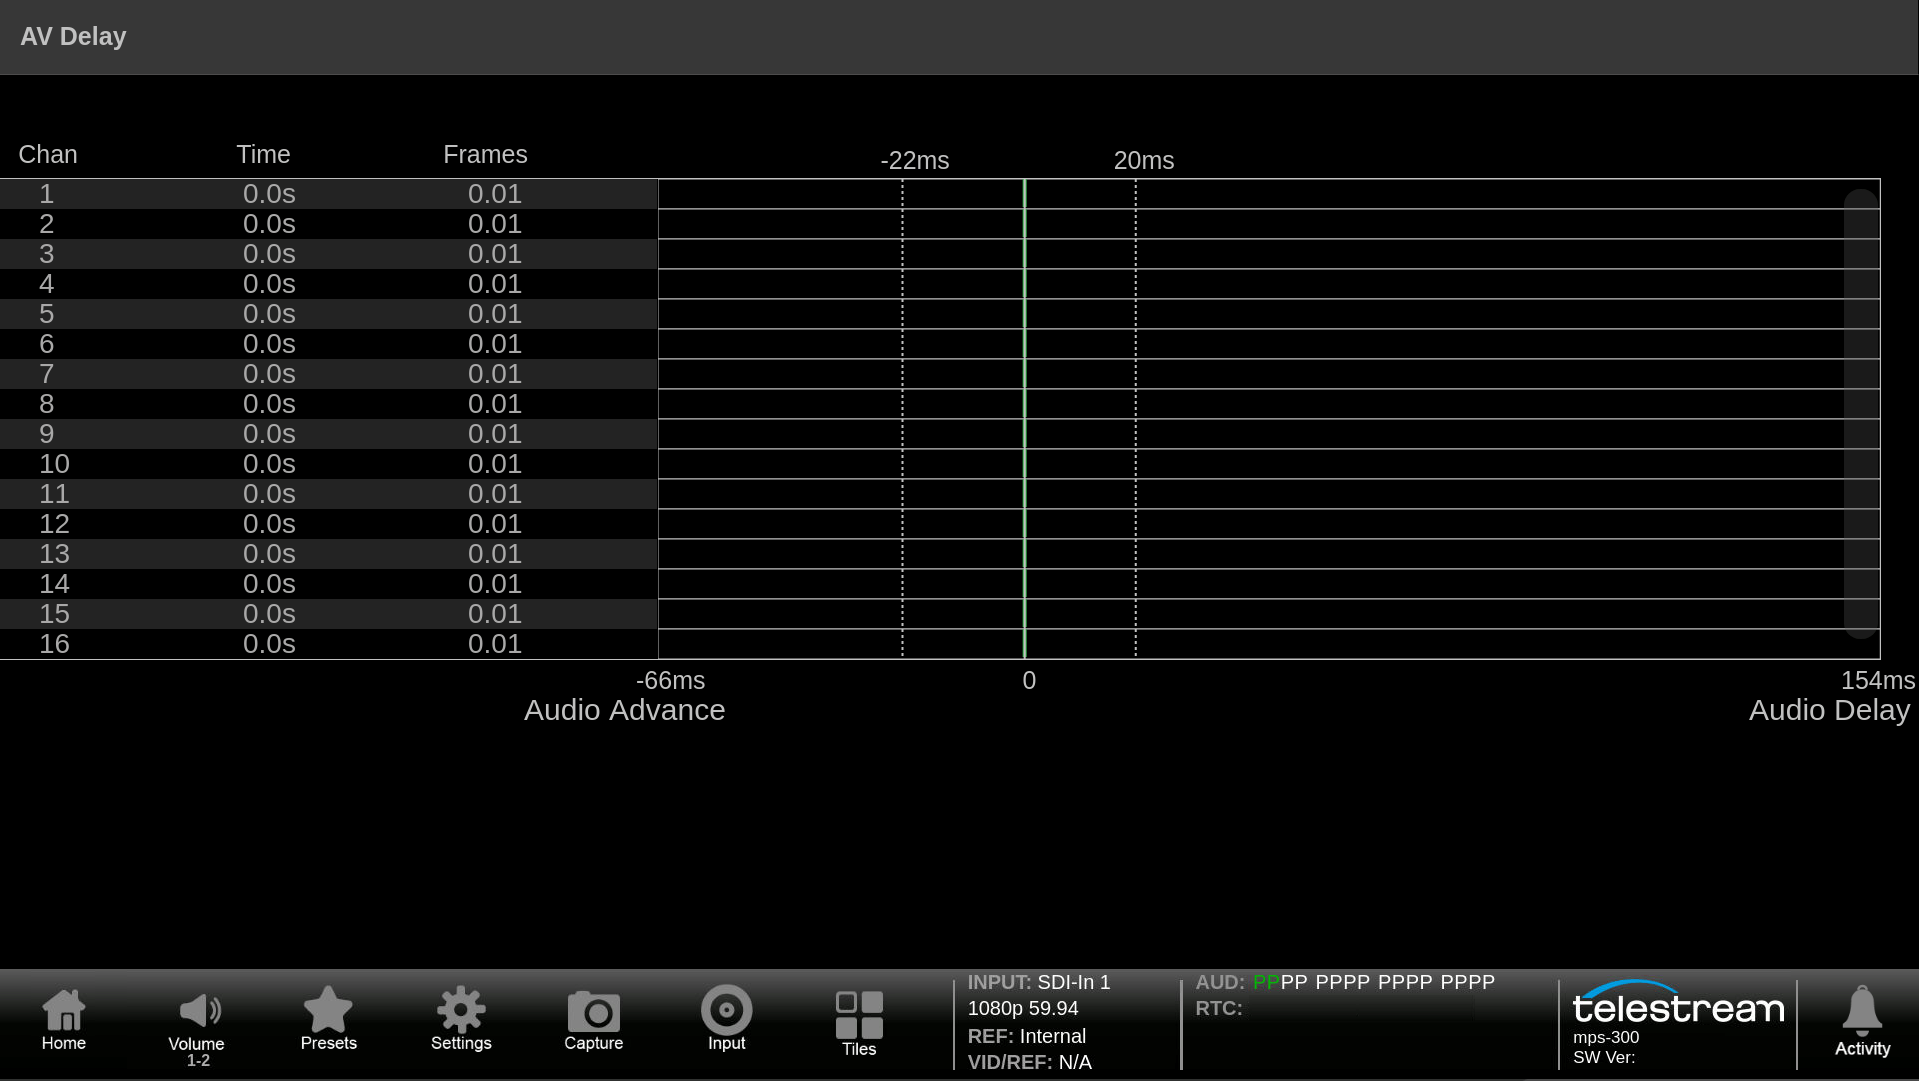
AV Delay measures the time difference of 16 channel audio against video simultaneously. Negative number means audio advance and positive number means audio delay.
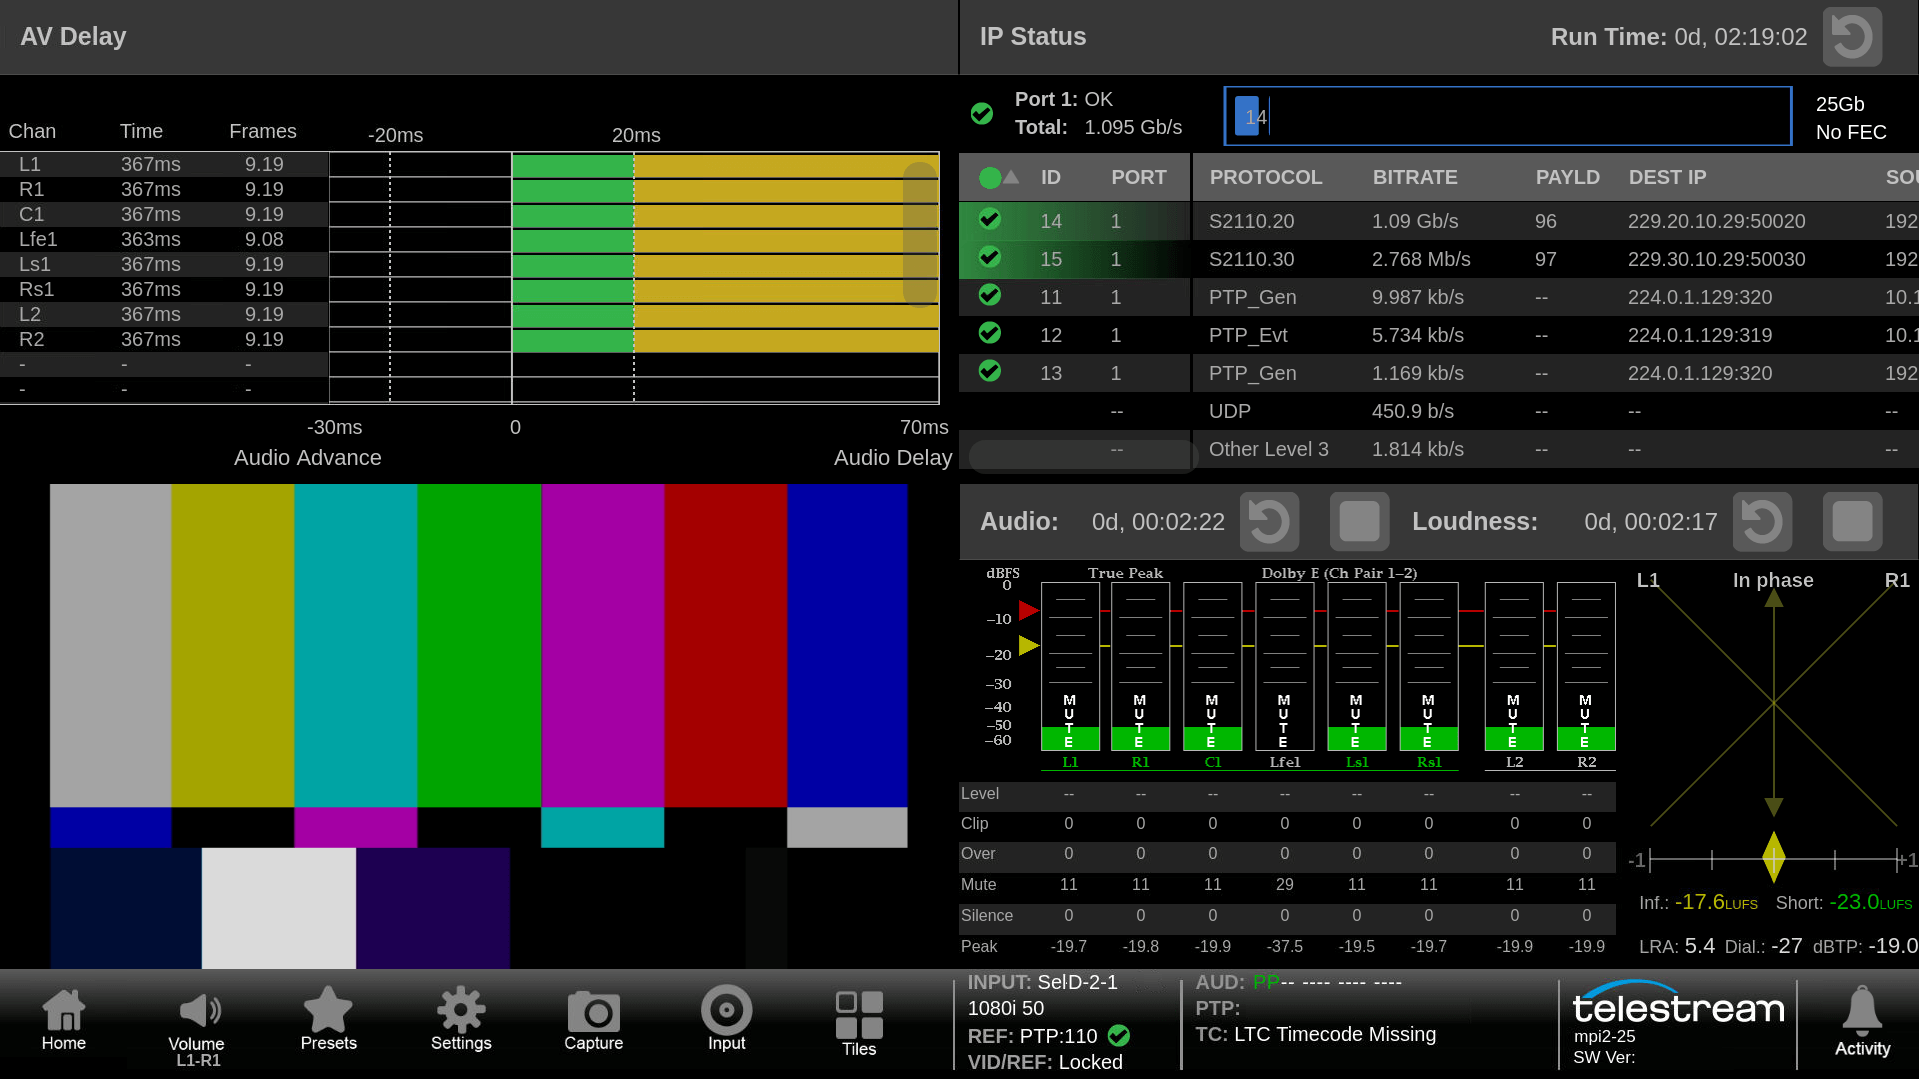
Dolby stream over SDI, ST 2022-6, ST 2110-30/31 will be internally decoded and measured against video. The labeling for each channel is automatically assigned from Dolby metadata.
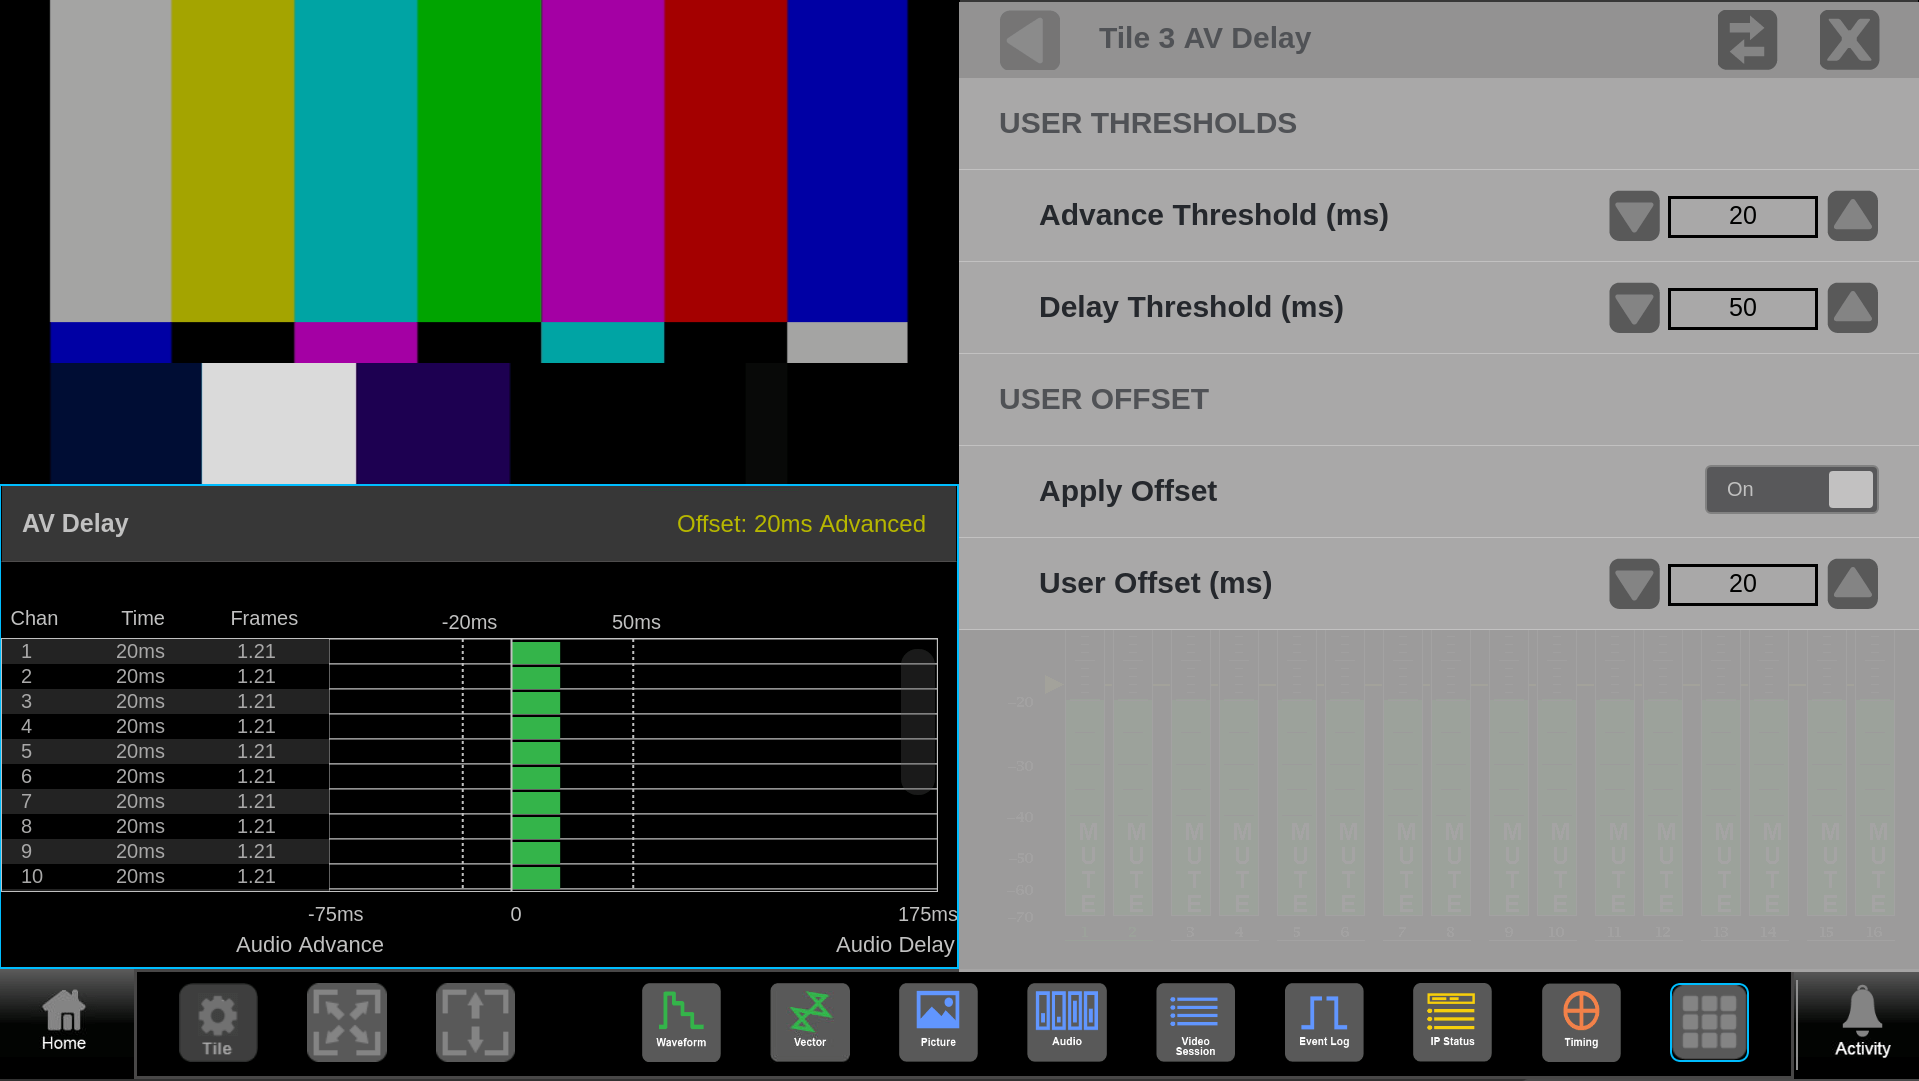
User threshold allows user to set warning level suitable for application. User can also manually add offset for relative measurement between signal paths or system configurations.
IP Display & Generator
IP Display provides the UI display image over ST2110-20. IP Generator provides a simple test pattern generator for ST 2110-20 / 2110-22 for color bars and audio tones. NMOS IS-04/05 is supported for sender. Requires GEN option for IP Generator. JPXS option required for JPEG XS (ST2110-22) test signal generation.
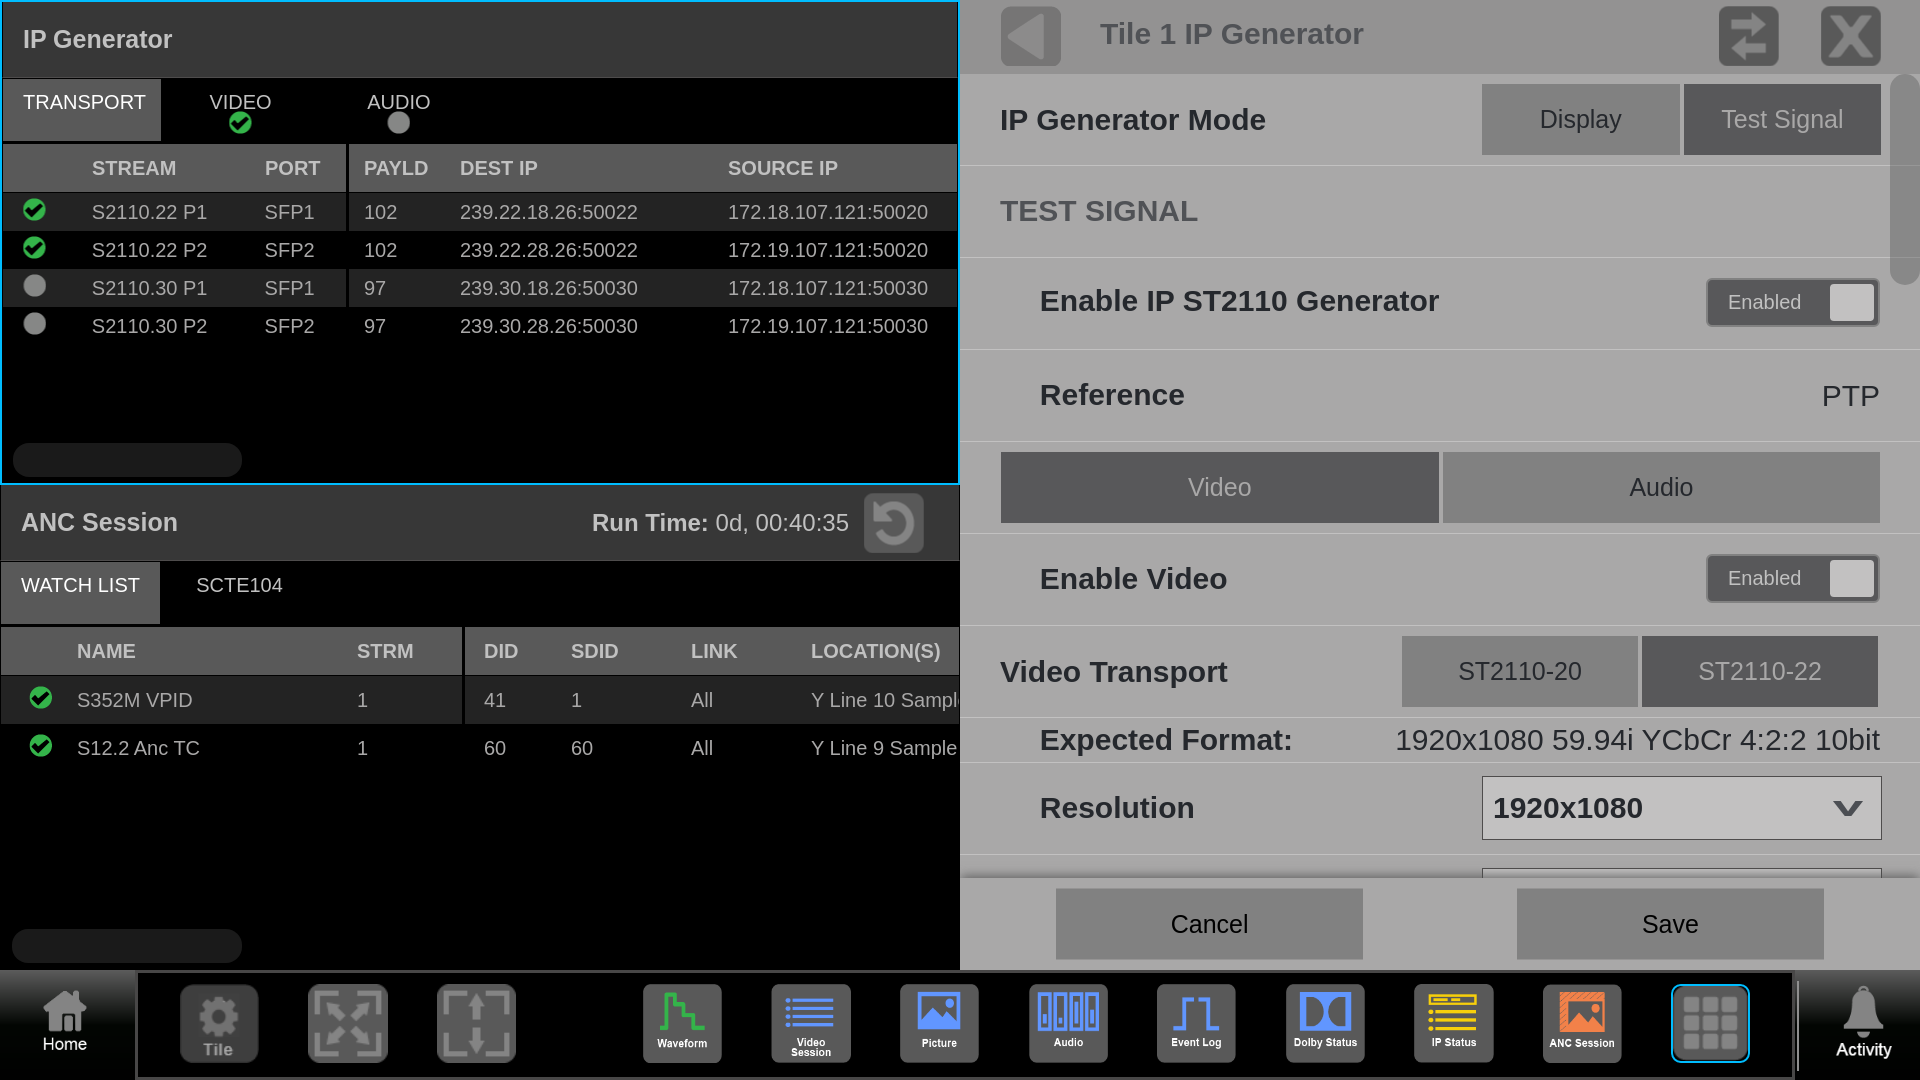
The ST 2110 IP Generator can be configured for 2110-20 or 2110-22 with a 100% color bar test signal in a variety of video formats. The user can enable one or both SFP port to generate the signal with user configured IP address and Payload Type as a Gapped or Narrow sender. For ST2110-22 signal generation the compression ratio can be selected.
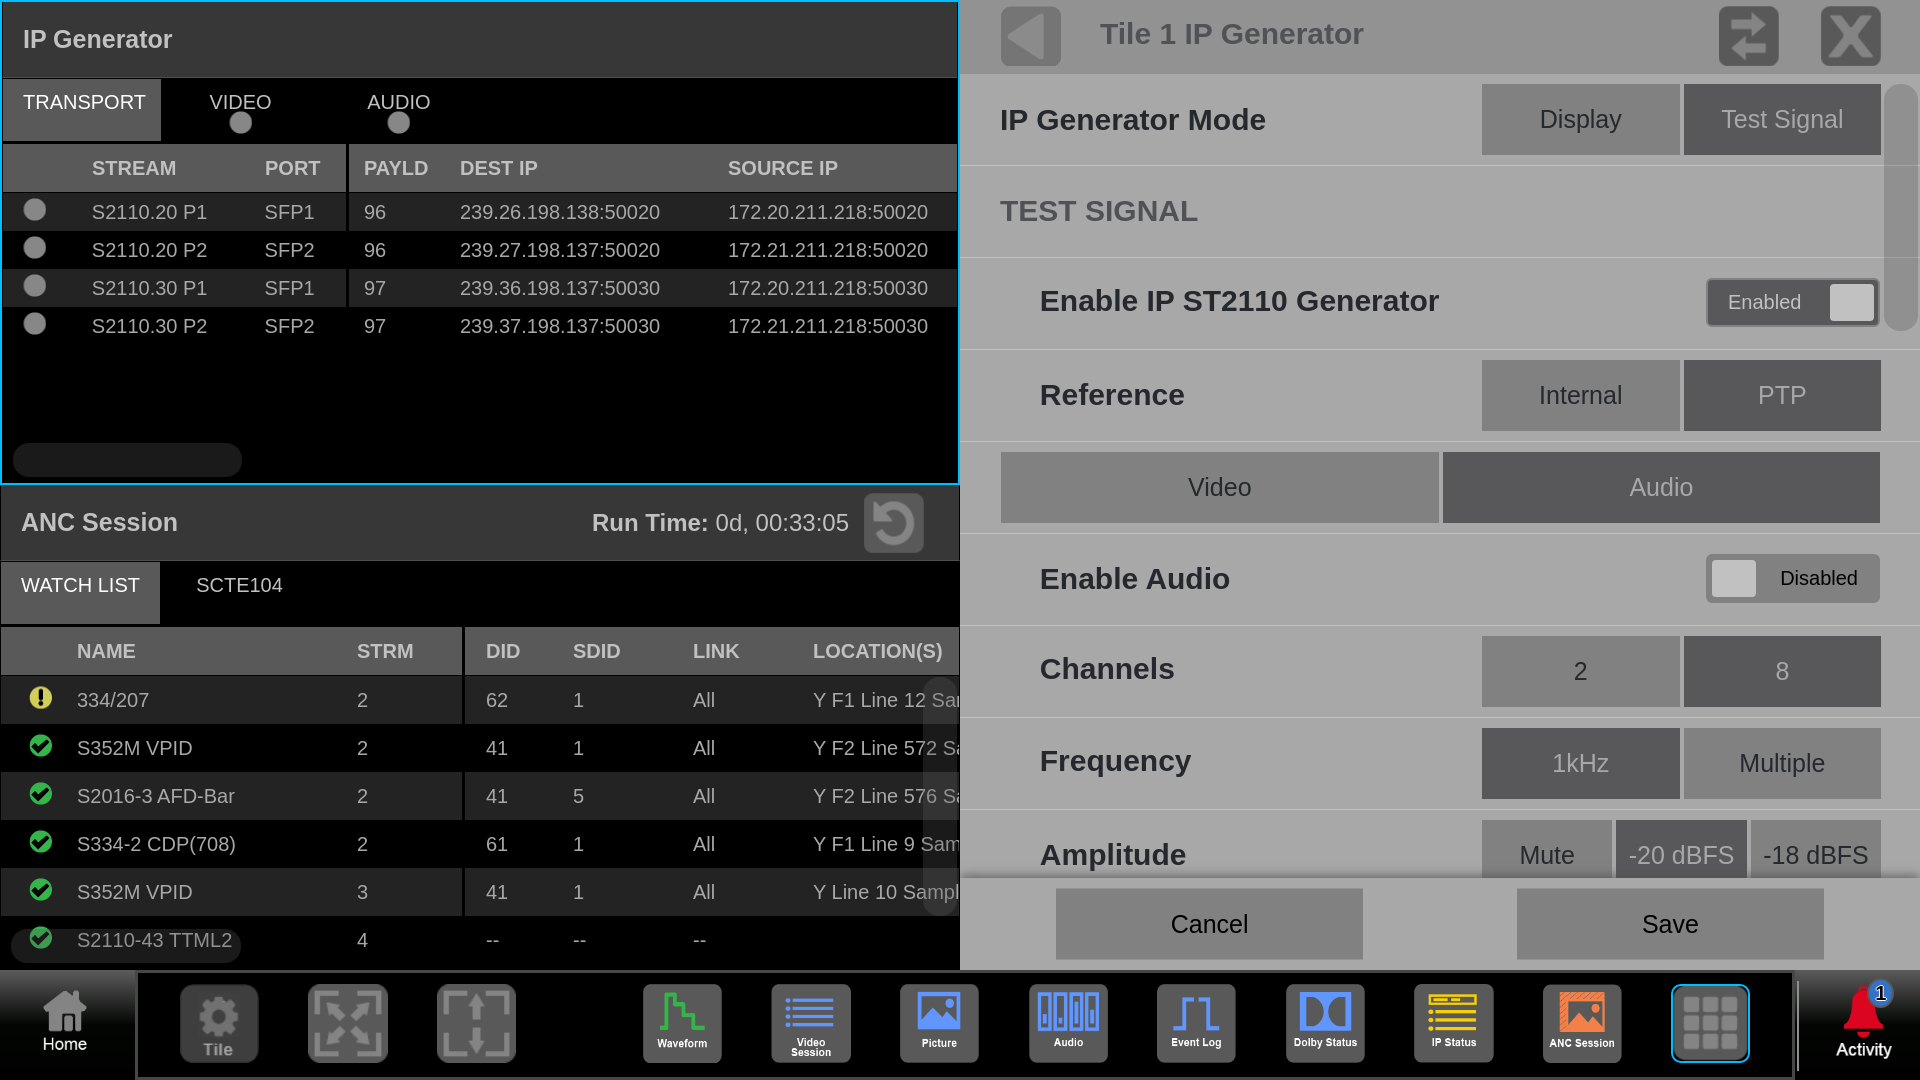
The audio tone generator can produce a 1kHz tone at -18 or -20dBFS or multiple frequency tone and at various levels. The packet time can be varied between 125 µs or 1ms with user configured IP address and Payload Type.
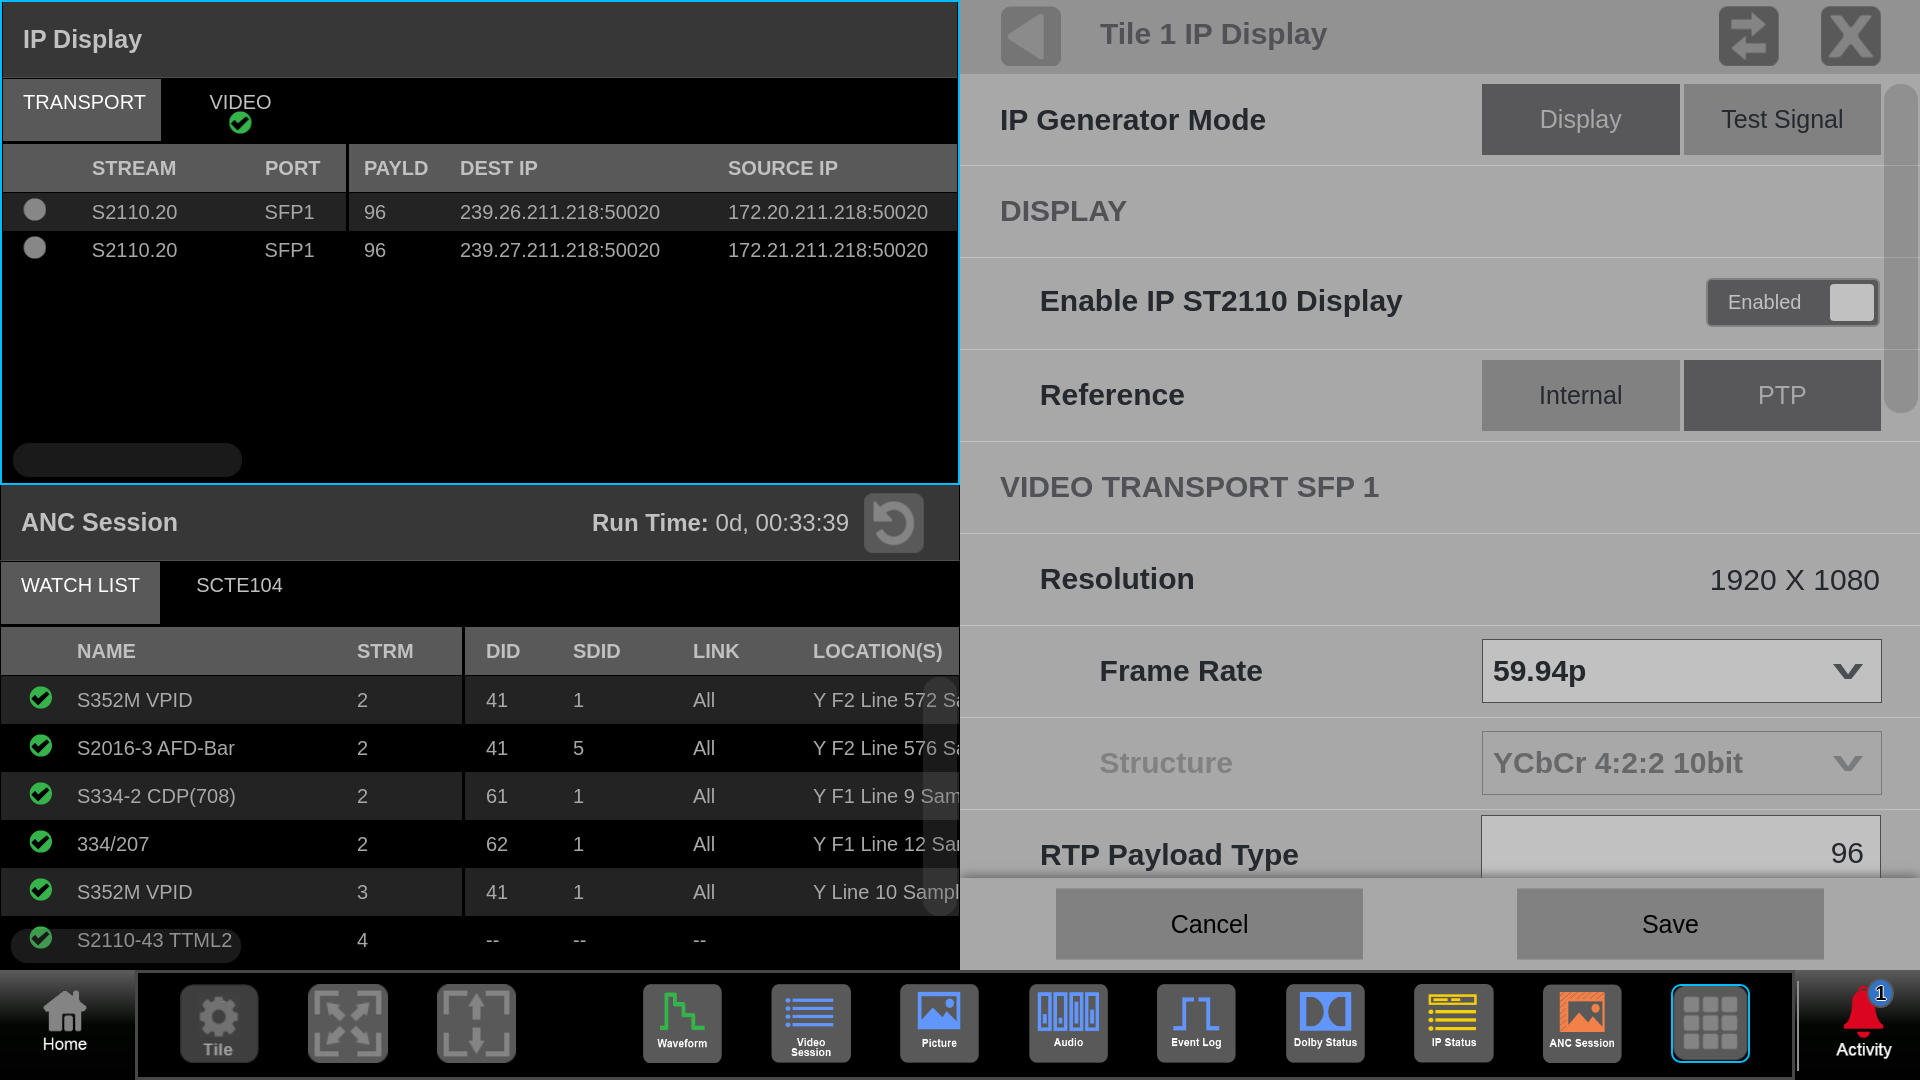
UI image can be output as 1080p50 or 1080p59 video over ST2110-20 through SFP1 port. Two ST2110-20 streams can be output for MPD models and unit with EXTNDSP mode being enabled.
SDI Generator
SDI Generator provides a simple test pattern generator with color bar test signal. Requires GEN option.
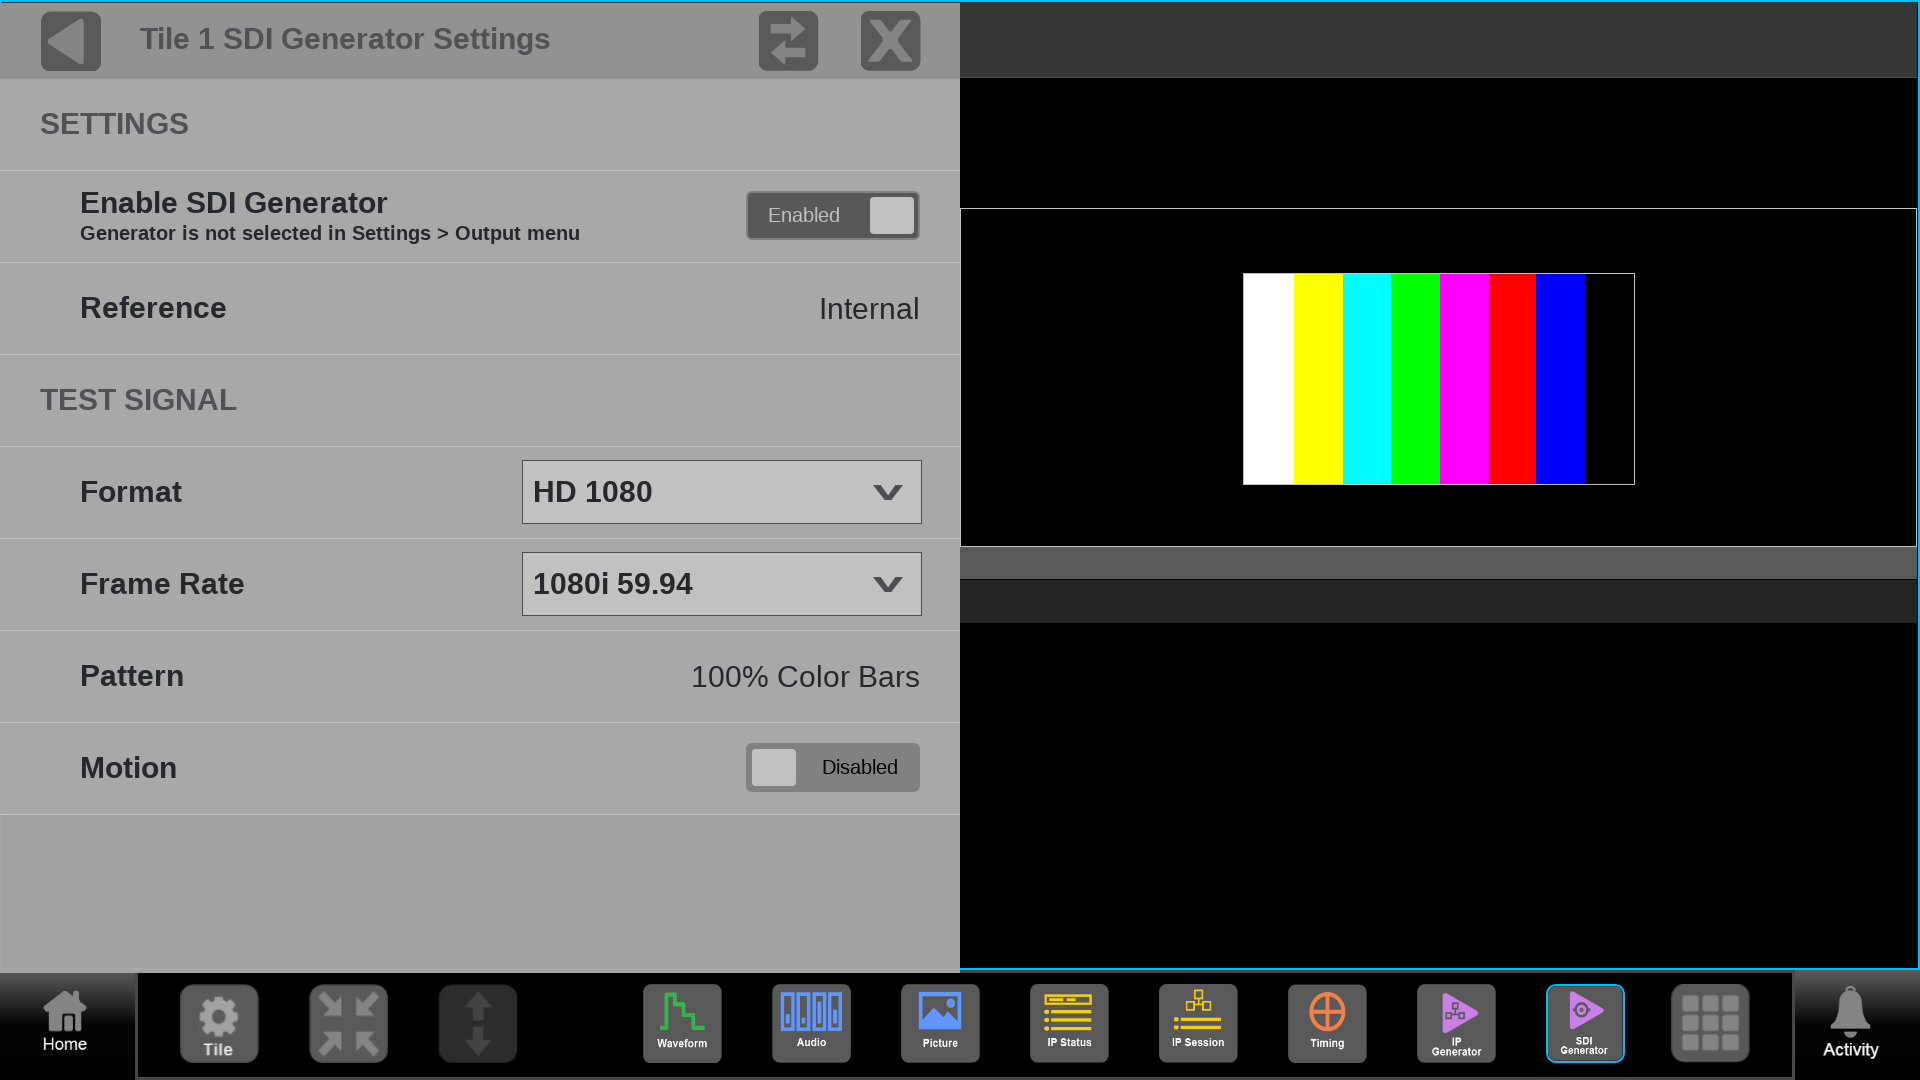
The user can configure a 100% Color Bar test signal to be generated in a variety of video formats from the SDI AUX output. Make sure to enable the Generator in the Output settings.
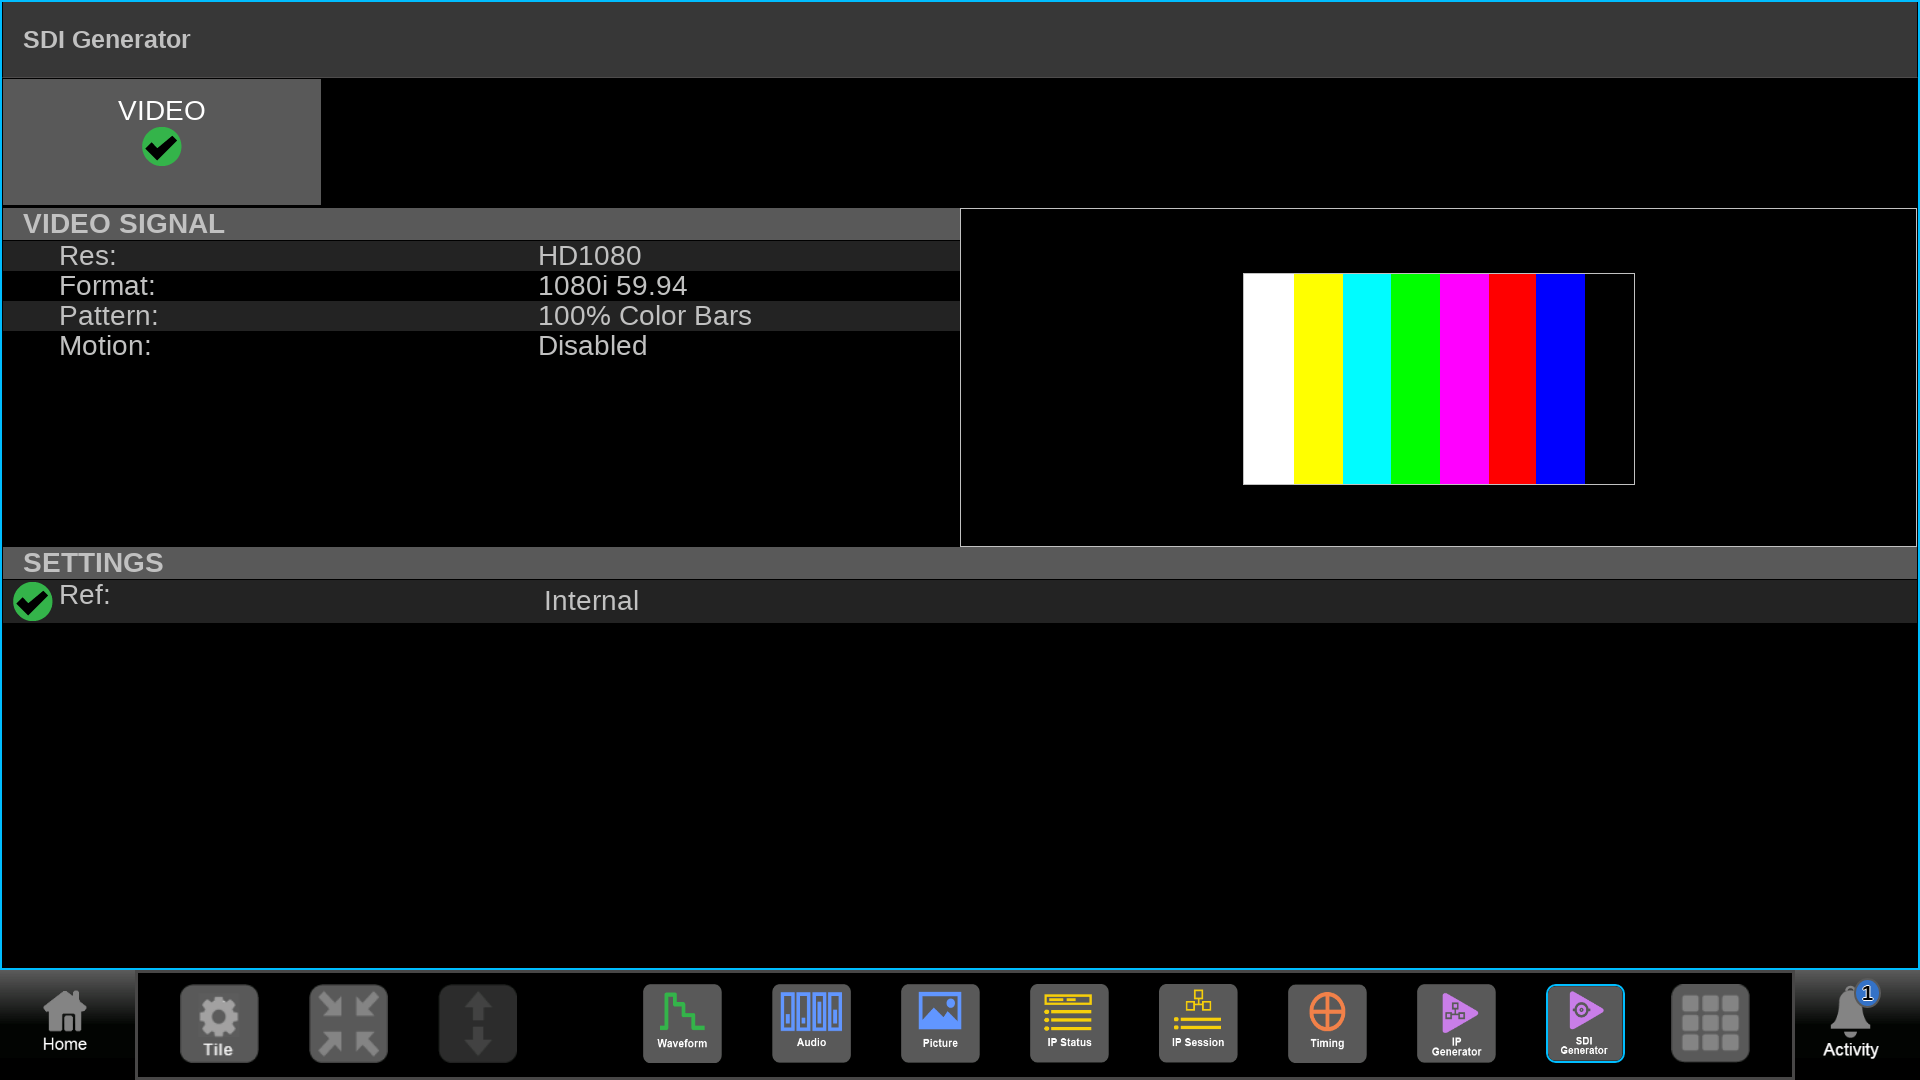
The SDI Generator Status display shows the configuration of the Test signal generator and a green tick indicator shows that the signal is enabled.
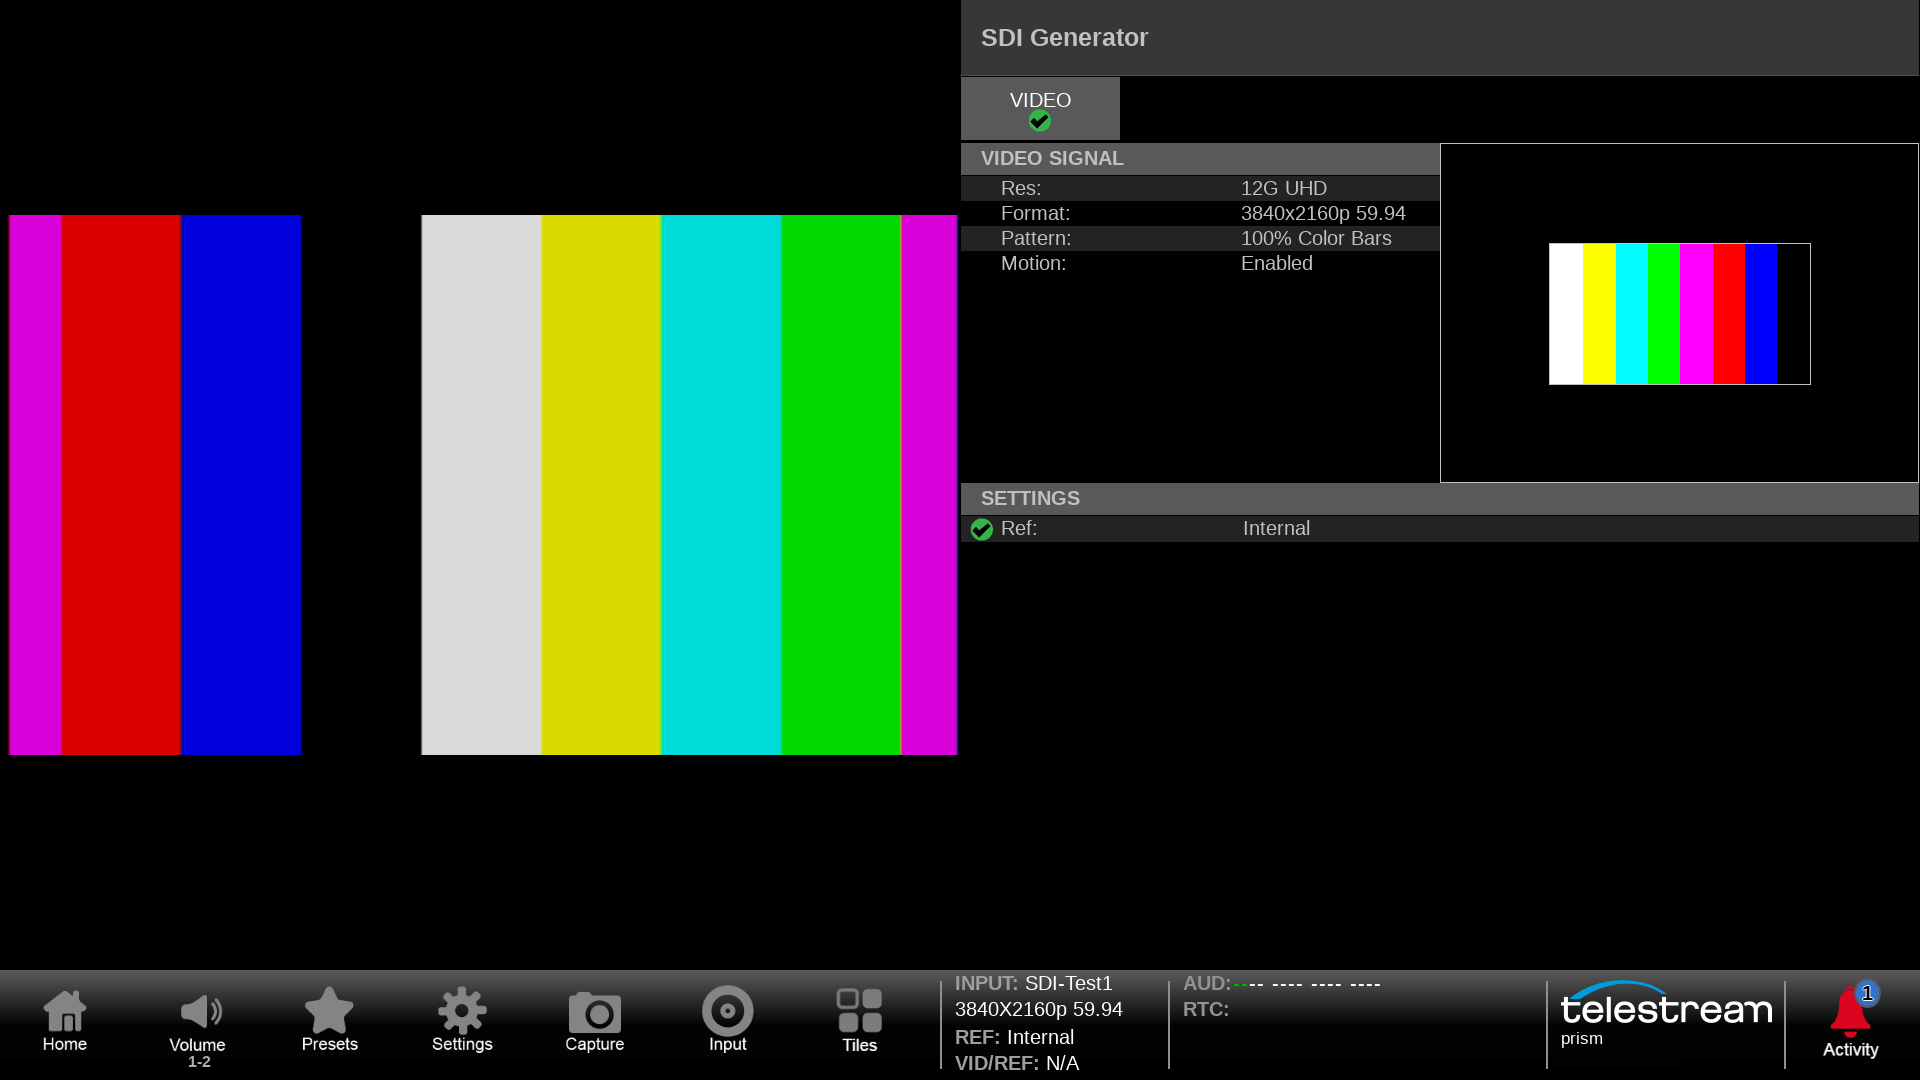
Motion can be enabled for the Test signal generator which will produce a horizontal scroll of the test pattern, to check that the device is processing the signal correctly.